## Diagram: Comparison of Two MLLM-Based Image Authenticity Classification Processes
### Overview
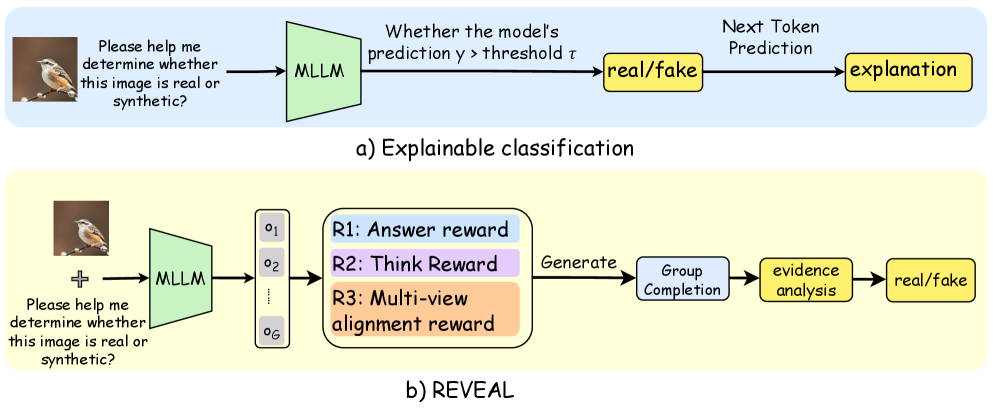
The image displays two flowcharts illustrating different methodological approaches for using a Multimodal Large Language Model (MLLM) to determine if an input image is real or synthetic (fake). The top diagram (a) depicts a straightforward "Explainable classification" pipeline. The bottom diagram (b) illustrates a more complex process named "REVEAL," which incorporates multiple outputs and reward-based refinement. Both processes begin with the same user prompt and an example input image of a bird.
### Components/Axes
The image is divided into two distinct horizontal sections:
1. **Top Section (a):** Has a light blue background. Labeled "a) Explainable classification" at the bottom center.
2. **Bottom Section (b):** Has a light yellow background. Labeled "b) REVEAL" at the bottom center.
**Common Elements:**
* **Input Image:** A small photograph of a bird (appears to be a robin) on a branch, positioned at the far left of both diagrams.
* **Input Prompt:** Text adjacent to the image reads: "Please help me determine whether this image is real or synthetic?"
* **MLLM Component:** Represented by a green trapezoid labeled "MLLM".
* **Output Labels:** Final classification outputs are in yellow rounded rectangles labeled "real/fake".
**Diagram (a) - Explainable Classification Components (Left to Right):**
1. Input Image & Prompt.
2. Green "MLLM" trapezoid.
3. A decision node described by text: "Whether the model's prediction y > threshold τ".
4. Yellow "real/fake" output box.
5. An arrow from "real/fake" points to a final yellow box labeled "explanation".
**Diagram (b) - REVEAL Components (Left to Right):**
1. Input Image & Prompt.
2. Green "MLLM" trapezoid.
3. A vertical stack of grey boxes labeled "o₁", "o₂", ..., "o_G", representing multiple outputs or samples.
4. A large rounded rectangle containing three colored reward function blocks:
* Blue: "R1: Answer reward"
* Purple: "R2: Think Reward"
* Orange: "R3: Multi-view alignment reward"
5. An arrow labeled "Generate" leads to a light blue box: "Group Completion".
6. An arrow leads to a yellow box: "evidence analysis".
7. A final arrow leads to the yellow "real/fake" output box.
### Detailed Analysis
**Process Flow for (a) Explainable Classification:**
The flow is linear and singular. The MLLM processes the input once. Its internal prediction score (`y`) is compared to a predefined threshold (`τ`). Based on this binary decision, it outputs a "real" or "fake" label and then generates a textual explanation for that decision.
**Process Flow for (b) REVEAL:**
The flow is iterative and multi-faceted. The MLLM generates multiple outputs (`o₁` through `o_G`). These outputs are evaluated by a composite reward system (R1, R2, R3) that assesses the answer, the reasoning ("Think"), and alignment across multiple views. This reward signal guides a "Group Completion" process, which synthesizes the outputs. The completed group undergoes "evidence analysis" before a final "real/fake" classification is made.
**Spatial Grounding & Legend:**
* In both diagrams, the flow is strictly left-to-right.
* The **green trapezoid** consistently represents the core MLLM component.
* **Yellow rounded rectangles** consistently represent final output states ("real/fake", "explanation", "evidence analysis").
* The **light blue background** in (a) and **light yellow background** in (b) serve as visual containers to separate the two distinct methodologies.
* In diagram (b), the reward functions are color-coded (blue, purple, orange) within their container, but these colors do not map to other elements in the flowchart.
### Key Observations
1. **Complexity Gradient:** Diagram (b) is significantly more complex than (a), introducing parallel generation (`o₁...o_G`), a multi-objective reward model, and a group-based synthesis step.
2. **Explanation Timing:** In (a), the "explanation" is generated *after* the classification decision. In (b), the "evidence analysis" (which could be seen as a form of explanation) is an integral step *before* the final classification.
3. **Decision Mechanism:** (a) relies on a simple threshold on a single prediction. (b) relies on aggregating and analyzing multiple outputs guided by learned rewards.
4. **Terminology:** (b) uses more specific terms like "Group Completion" and "evidence analysis," suggesting a more structured reasoning process compared to the generic "explanation" in (a).
### Interpretation
These diagrams contrast two paradigms for AI-assisted authenticity detection:
* **Diagram (a) represents a "Direct Inference with Justification" model.** It's a classic classifier that makes a decision and then rationalizes it. The process is transparent but potentially simplistic, as the explanation is post-hoc and may not reflect the true decision-making process. The threshold `τ` is a critical, fixed parameter.
* **Diagram (b) represents a "Deliberative, Reward-Driven Reasoning" model (REVEAL).** This approach treats the problem as a reasoning task rather than pure classification. By generating multiple hypotheses (`o₁...o_G`) and optimizing for rewards related to answer quality, reasoning depth ("Think"), and consistency ("Multi-view alignment"), it aims for a more robust and verifiable conclusion. The "Group Completion" and "evidence analysis" steps suggest a process akin to debate or peer review among the model's own outputs, potentially leading to higher accuracy and more trustworthy explanations that are integral to the decision, not an afterthought.
The progression from (a) to (b) illustrates a trend in advanced AI systems: moving from single-pass prediction to multi-step, self-critiquing, and reward-optimized reasoning chains for complex tasks where justification and reliability are as important as the final answer.