## Chart: LM Loss vs. PFLOP/s-days
### Overview
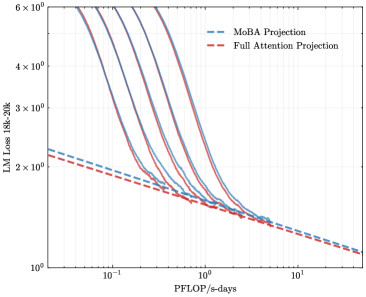
The image is a line chart comparing the Language Model (LM) Loss of MoBA Projection and Full Attention Projection models against the computational cost measured in PFLOP/s-days. The chart displays multiple runs or configurations for each model type, showing how loss decreases with increased computation.
### Components/Axes
* **Title:** LM Loss 18k-20k
* **X-axis:** PFLOP/s-days (Logarithmic scale from 0.01 to 10)
* **Y-axis:** LM Loss 18k-20k (Logarithmic scale from 1 to 6 x 10^0)
* **Legend (Top-Right):**
* Blue dashed line: MoBA Projection
* Red dashed line: Full Attention Projection
### Detailed Analysis
* **MoBA Projection (Blue lines):** There are multiple blue lines, each representing a different run or configuration of the MoBA Projection model. All lines show a general downward trend, indicating that LM Loss decreases as PFLOP/s-days increases.
* The leftmost MoBA Projection line starts at approximately (0.04, 6) and decreases to approximately (2, 1.3).
* The rightmost MoBA Projection line starts at approximately (0.2, 6) and decreases to approximately (10, 1.1).
* **Full Attention Projection (Red lines):** There are multiple red lines, each representing a different run or configuration of the Full Attention Projection model. All lines show a general downward trend, indicating that LM Loss decreases as PFLOP/s-days increases.
* The leftmost Full Attention Projection line starts at approximately (0.04, 6) and decreases to approximately (2, 1.3).
* The rightmost Full Attention Projection line starts at approximately (0.2, 6) and decreases to approximately (10, 1.1).
* **Dashed Lines:**
* The blue dashed line (MoBA Projection) starts at approximately (0.04, 2.2) and decreases to approximately (10, 1.1).
* The red dashed line (Full Attention Projection) starts at approximately (0.04, 2.2) and decreases to approximately (10, 1.1).
### Key Observations
* Both MoBA Projection and Full Attention Projection models exhibit a decrease in LM Loss as computational cost (PFLOP/s-days) increases.
* The multiple lines for each model type suggest variability in performance across different runs or configurations.
* The dashed lines representing MoBA Projection and Full Attention Projection are very close to each other, suggesting similar performance.
### Interpretation
The chart demonstrates the relationship between computational cost and language model loss for two different projection methods: MoBA Projection and Full Attention Projection. The downward trend of the lines indicates that increasing the computational budget generally leads to a reduction in LM Loss for both methods. The proximity of the dashed lines suggests that, on average, the two methods achieve similar performance levels within the tested range of computational costs. The multiple lines for each model indicate that the performance can vary depending on the specific configuration or run, highlighting the importance of tuning and optimization.