## Bar Chart: Accuracy Comparison Across Models
### Overview
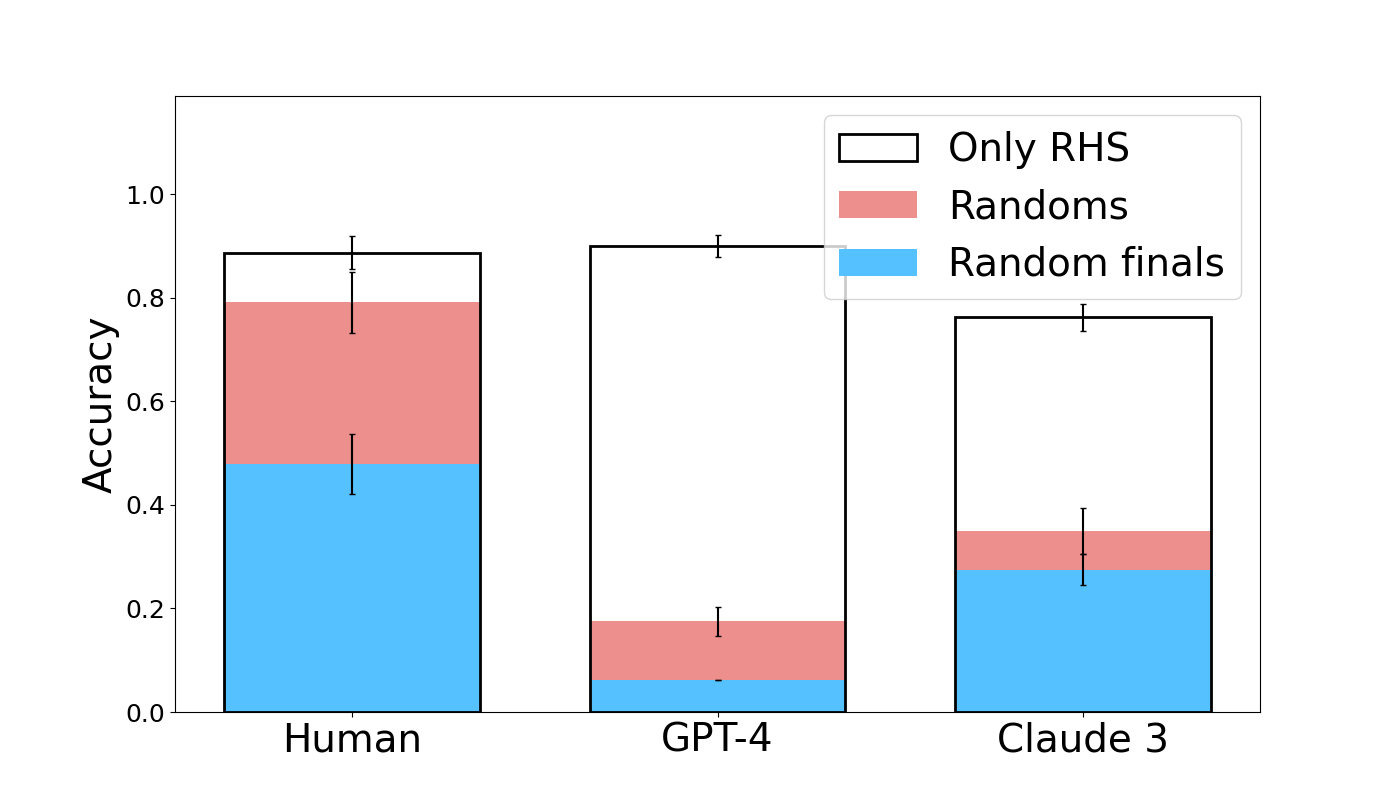
The chart compares accuracy metrics across three models (Human, GPT-4, Claude 3) using three evaluation methods: "Only RHS" (black), "Randoms" (red), and "Random finals" (blue). Accuracy values range from 0.0 to 1.0 on the y-axis, with error bars indicating variability.
### Components/Axes
- **X-axis**: Models (Human, GPT-4, Claude 3)
- **Y-axis**: Accuracy (0.0–1.0)
- **Legend**:
- Black: Only RHS
- Red: Randoms
- Blue: Random finals
- **Error bars**: Vertical lines on top of each bar segment
### Detailed Analysis
1. **Human**:
- Total accuracy: ~0.85
- Breakdown:
- Blue (Random finals): ~0.45
- Red (Randoms): ~0.35
- Black (Only RHS): ~0.05
- Error bars: ±0.05–0.10
2. **GPT-4**:
- Total accuracy: ~0.90
- Breakdown:
- Blue (Random finals): ~0.05
- Red (Randoms): ~0.15
- Black (Only RHS): ~0.70
- Error bars: ±0.05–0.10
3. **Claude 3**:
- Total accuracy: ~0.75
- Breakdown:
- Blue (Random finals): ~0.25
- Red (Randoms): ~0.10
- Black (Only RHS): ~0.40
- Error bars: ±0.05–0.10
### Key Observations
- **Human performance** is dominated by "Random finals" (blue), contributing ~53% of total accuracy.
- **GPT-4** relies almost exclusively on "Only RHS" (black), accounting for ~78% of its accuracy.
- **Claude 3** shows a more balanced distribution but lower overall accuracy, with "Only RHS" still being the largest contributor (~53%).
- All models exhibit similar error margins (~±0.05–0.10), suggesting comparable measurement precision.
### Interpretation
The data suggests that:
1. **Human cognition** integrates multiple strategies, with "Random finals" playing a significant role.
2. **GPT-4** heavily depends on "Only RHS" methodology, indicating potential over-reliance on a single approach.
3. **Claude 3** demonstrates moderate performance across methods but lacks the synergistic effect seen in human performance.
4. The error bars imply that accuracy measurements are relatively stable across models, though GPT-4's high accuracy may be less generalizable due to its narrow methodological focus.
The chart highlights trade-offs between methodological diversity and performance, with humans showing the most balanced and highest overall accuracy.