## Diagram: Claim Veracity Prediction Flow
### Overview
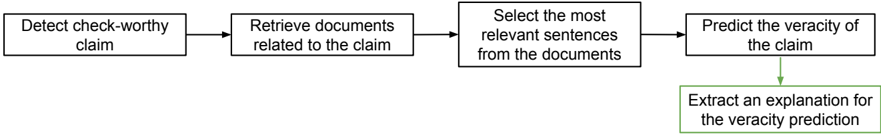
The image is a flowchart illustrating the steps involved in predicting the veracity of a claim. It starts with detecting a check-worthy claim, retrieving related documents, selecting relevant sentences, predicting the claim's veracity, and finally, extracting an explanation for the veracity prediction.
### Components/Axes
The diagram consists of five rectangular boxes, each representing a step in the process. The boxes are connected by arrows indicating the flow of information.
* **Box 1 (Top-Left):** "Detect check-worthy claim"
* **Box 2 (Top-Middle-Left):** "Retrieve documents related to the claim"
* **Box 3 (Top-Middle-Right):** "Select the most relevant sentences from the documents"
* **Box 4 (Top-Right):** "Predict the veracity of the claim"
* **Box 5 (Bottom-Right):** "Extract an explanation for the veracity prediction" (This box is green, while the others are black)
The arrows indicate the direction of the process:
* Arrow 1: From Box 1 to Box 2
* Arrow 2: From Box 2 to Box 3
* Arrow 3: From Box 3 to Box 4
* Arrow 4: From Box 4 to Box 5 (This arrow is green, while the others are black)
### Detailed Analysis or Content Details
The flowchart outlines a sequential process.
1. **Detect check-worthy claim:** The process begins by identifying a claim that warrants verification.
2. **Retrieve documents related to the claim:** Relevant documents are gathered to provide context and evidence for the claim.
3. **Select the most relevant sentences from the documents:** The most pertinent sentences are extracted from the retrieved documents.
4. **Predict the veracity of the claim:** Based on the selected sentences, a prediction is made regarding the truthfulness of the claim.
5. **Extract an explanation for the veracity prediction:** An explanation is generated to justify the veracity prediction.
The final step (Box 5) and its connecting arrow are highlighted in green, suggesting a particular emphasis on the explanation extraction process.
### Key Observations
* The flowchart presents a clear, step-by-step process for claim verification.
* The green color of the last step and its connecting arrow emphasizes the importance of explaining the veracity prediction.
### Interpretation
The diagram illustrates a system designed to automate or assist in the fact-checking process. The flow starts with identifying a claim and progresses through information retrieval, analysis, prediction, and explanation. The emphasis on extracting an explanation suggests a focus on transparency and interpretability of the veracity prediction. The system aims to not only predict whether a claim is true or false but also to provide a rationale for that prediction.