\n
## Diagram: Fact Verification Pipeline
### Overview
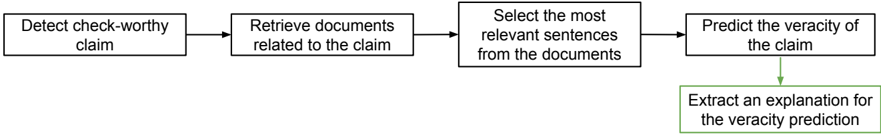
The image depicts a flowchart illustrating a pipeline for fact verification. It outlines the sequential steps involved in assessing the veracity of a claim, from initial detection to explanation generation.
### Components/Axes
The diagram consists of five rectangular blocks representing the stages of the pipeline, connected by arrows indicating the flow of information. The blocks contain the following text:
1. "Detect check-worthy claim"
2. "Retrieve documents related to the claim"
3. "Select the most relevant sentences from the documents"
4. "Predict the veracity of the claim"
5. "Extract an explanation for the veracity prediction"
The blocks are colored as follows:
* Blocks 1-3 are yellow.
* Block 4 is light blue.
* Block 5 is light green.
An arrow originates from block 4 and points to block 5.
### Detailed Analysis or Content Details
The diagram shows a linear process. The process begins with identifying a claim that requires verification. This is followed by searching for relevant documents. The most pertinent sentences from these documents are then selected. Based on this information, the veracity of the claim is predicted. Finally, an explanation is generated to justify the veracity prediction.
### Key Observations
The diagram highlights a sequential, multi-stage process. The final stage, explanation generation, is visually distinct as it branches off from the main flow, suggesting it's a secondary output of the veracity prediction. The color coding may indicate different types of processing or components within the pipeline.
### Interpretation
This diagram represents a typical workflow for automated fact-checking systems. It demonstrates the core steps involved in verifying information: identifying a claim, gathering evidence, analyzing the evidence, making a judgment, and providing justification for that judgment. The pipeline suggests a system that aims not only to determine whether a claim is true or false but also to explain *why* it reached that conclusion. This is crucial for building trust and transparency in automated fact-checking. The diagram does not provide any quantitative data or specific details about the algorithms or techniques used in each stage; it is a high-level overview of the process.