## Line Graph: Qwen3-8B Compression Efficiency Analysis
### Overview
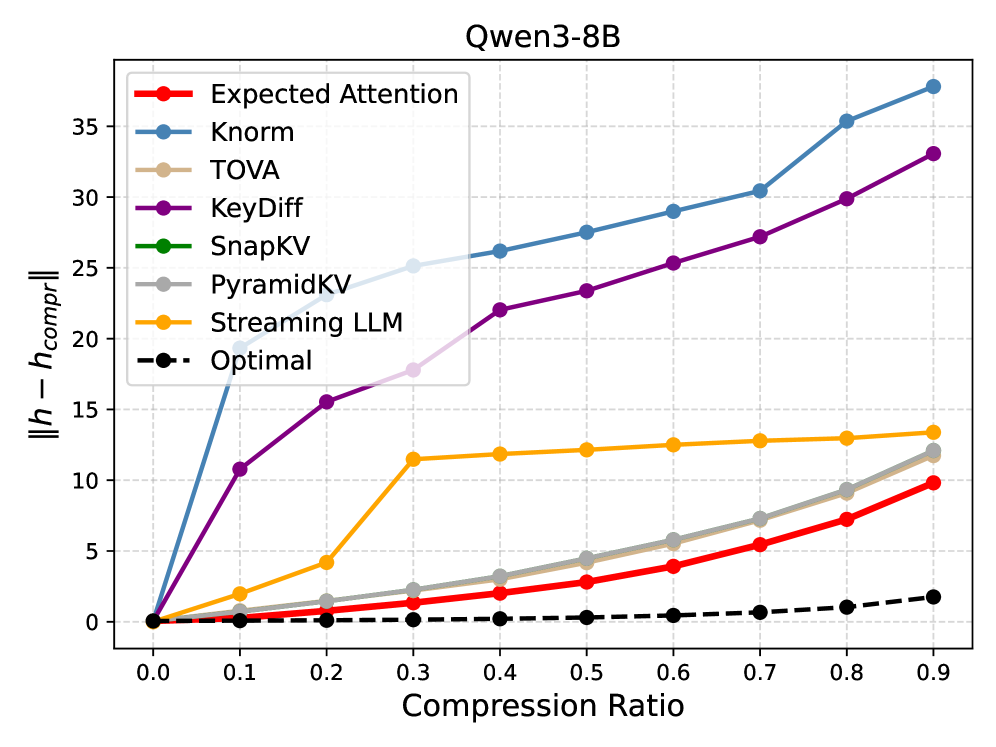
The graph compares the compression efficiency of various methods applied to the Qwen3-8B model. The y-axis measures the discrepancy between original and compressed model sizes (`||h - h_compr||`), while the x-axis represents compression ratios from 0.0 to 0.9. Eight distinct methods are visualized, with performance trends showing significant variation across compression levels.
### Components/Axes
- **X-axis**: Compression Ratio (0.0 to 0.9 in 0.1 increments)
- **Y-axis**: Discrepancy in model size (`||h - h_compr||`) from 0 to 35
- **Legend**: Located in top-left corner with 8 color-coded methods:
- Red: Expected Attention
- Blue: Knorm
- Beige: TOVA
- Purple: KeyDiff
- Green: SnapKV
- Gray: PyramidKV
- Orange: Streaming LLM
- Black dashed: Optimal
### Detailed Analysis
1. **Knorm (Blue)**:
- Starts at 0.0, rises sharply to ~20 at 0.1 compression
- Gradually increases to ~38 at 0.9 compression
- Shows consistent upward trend with no plateaus
2. **KeyDiff (Purple)**:
- Begins at 0.0, rises to ~11 at 0.1
- Steady increase to ~33 at 0.9
- Slightly less steep than Knorm but maintains linear growth
3. **TOVA (Beige)**:
- Remains at 0 across all compression ratios
- Perfect horizontal line at baseline
4. **SnapKV (Green)**:
- Identical to TOVA (0 discrepancy)
- Perfect horizontal line at baseline
5. **PyramidKV (Gray)**:
- Starts at 0, rises to ~12 at 0.9
- Gradual linear increase with minimal curvature
6. **Streaming LLM (Orange)**:
- Starts at 0, rises to ~13 at 0.9
- Slightly curved upward trend
7. **Expected Attention (Red)**:
- Starts at 0, rises to ~10 at 0.9
- Moderate linear increase
8. **Optimal (Black dashed)**:
- Remains at 0 across all ratios
- Perfect baseline reference
### Key Observations
- **Highest Discrepancy**: Knorm (38 at 0.9) and KeyDiff (33 at 0.9) show worst compression efficiency
- **Optimal Performance**: TOVA and SnapKV maintain perfect compression (0 discrepancy)
- **Mid-Range Performance**: PyramidKV (12), Streaming LLM (13), and Expected Attention (10) show moderate efficiency
- **Baseline Comparison**: All methods except TOVA/SnapKV perform worse than the Optimal baseline
### Interpretation
The graph demonstrates significant variation in compression efficiency among different methods. TOVA and SnapKV achieve perfect compression (0 discrepancy) across all ratios, suggesting they are optimal for this model. Knorm and KeyDiff show the poorest performance, with discrepancies exceeding 35 at maximum compression. The linear trends of most methods indicate consistent performance degradation with higher compression ratios. Notably, the Optimal baseline (black dashed line) serves as a critical reference point, revealing that most methods fail to maintain compression efficiency comparable to the ideal scenario. This analysis suggests that method selection should prioritize TOVA/SnapKV for compression tasks while avoiding Knorm/KeyDiff for high-compression applications.