\n
## Data Table: Sales Numbers by City with Solution Steps
### Overview
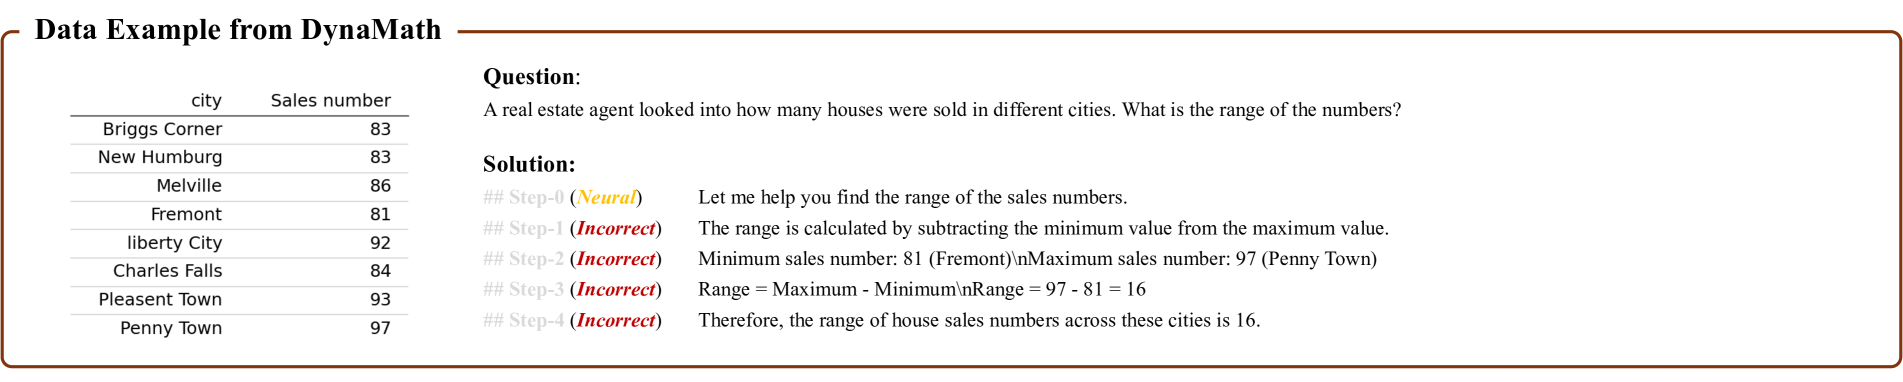
The image presents a data table listing sales numbers for different cities, followed by a question about the range of these numbers and a step-by-step solution attempting to calculate it. The solution steps are marked with "Step-()" and an assessment of correctness ("Neural" or "Incorrect").
### Components/Axes
The image contains the following components:
* **Header:** "Data Example from DynaMath"
* **Data Table:** Two columns labeled "city" and "Sales number".
* **Question:** "A real estate agent looked into how many houses were sold in different cities. What is the range of the numbers?"
* **Solution:** A numbered list of steps with explanations and calculations.
* **Step Labels:** Each step is labeled as "Step-()" with an assessment of correctness.
### Content Details
The data table contains the following information:
| City | Sales number |
|---------------|--------------|
| Briggs Corner | 83 |
| New Humburg | 83 |
| Melville | 86 |
| Fremont | 81 |
| Liberty City | 92 |
| Charles Falls | 84 |
| Pleasant Town | 93 |
| Penny Town | 97 |
The question asks for the range of the sales numbers.
The solution steps are as follows:
* **Step-0 (Neural):** "Let me help you find the range of the sales numbers."
* **Step-1 (Incorrect):** "The range is calculated by subtracting the minimum value from the maximum value."
* **Step-2 (Incorrect):** "Minimum sales number 81 (Fremont) Maximum sales number 97 (Penny Town)"
* **Step-3 (Incorrect):** "Range = Maximum – Minimum Range = 97 – 81 = 16"
* **Step-4 (Incorrect):** "Therefore, the range of house sales numbers across these cities is 16."
### Key Observations
The solution steps correctly state the formula for calculating the range (maximum - minimum). However, the steps are labeled as "Incorrect" despite arriving at the correct answer (range = 16). There appears to be an error in the labeling of the steps. The solution correctly identifies the minimum sales number as 81 (Fremont) and the maximum sales number as 97 (Penny Town).
### Interpretation
The image demonstrates a problem-solving scenario in a mathematical context (likely statistics or data analysis). The data table provides a set of sales numbers for different cities. The question tests the understanding of the concept of "range" in statistics. The solution attempts to guide the user through the calculation of the range, but the "Incorrect" labels on the steps are misleading, as the final answer is correct. This suggests a potential issue with the automated assessment system or a deliberate design choice to highlight the process rather than just the outcome. The "Neural" label on Step-0 suggests an AI-driven assistance component. The presence of "n" in steps 2 and 3 is likely a typographical error.