\n
## Data Table with Problem-Solving Example: House Sales Range Calculation
### Overview
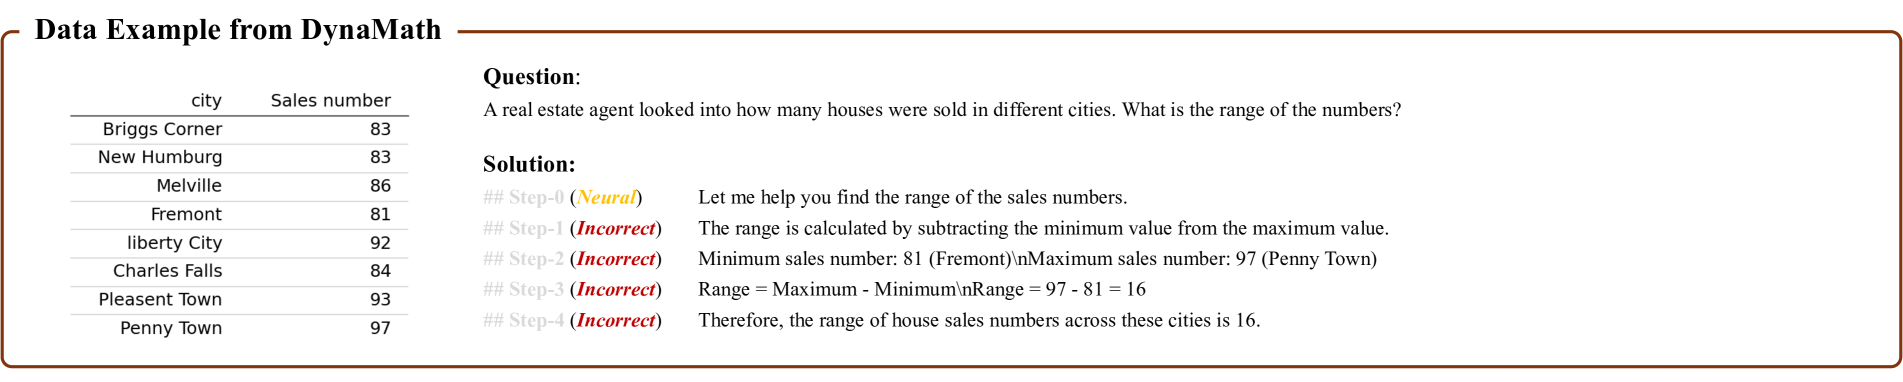
The image displays a data example from "DynaMath," presenting a table of house sales numbers for various cities alongside a mathematical question and a step-by-step solution. The solution provided contains multiple errors, which are explicitly labeled.
### Components/Axes
The image is divided into two main sections within a brown-bordered frame:
1. **Left Section (Data Table):** A two-column table.
* **Column 1 Header:** `city`
* **Column 2 Header:** `Sales number`
* The table lists 8 cities and their corresponding sales figures.
2. **Right Section (Problem & Solution):**
* **Question:** "A real estate agent looked into how many houses were sold in different cities. What is the range of the numbers?"
* **Solution:** A 5-step process (Step-0 to Step-4). Each step is prefixed with a label in gray text (e.g., "## Step-0") followed by a status in parentheses. The status is either "(Neural)" in yellow or "(Incorrect)" in red.
### Detailed Analysis
**Data Table Content:**
| city | Sales number |
| :--- | :--- |
| Briggs Corner | 83 |
| New Humburg | 83 |
| Melville | 86 |
| Fremont | 81 |
| liberty City | 92 |
| Charles Falls | 84 |
| Pleasent Town | 93 |
| Penny Town | 97 |
**Solution Steps Transcription:**
* **Step-0 (Neural):** Let me help you find the range of the sales numbers.
* **Step-1 (Incorrect):** The range is calculated by subtracting the minimum value from the maximum value.
* **Step-2 (Incorrect):** Minimum sales number: 81 (Fremont)
Maximum sales number: 97 (Penny Town)
* **Step-3 (Incorrect):** Range = Maximum - Minimum
Range = 97 - 81 = 16
* **Step-4 (Incorrect):** Therefore, the range of house sales numbers across these cities is 16.
### Key Observations
1. **Data Discrepancy:** The solution in Step-2 incorrectly identifies the maximum sales number as 97 (Penny Town). According to the provided table, the correct maximum value is 93 (Pleasant Town). Penny Town's value of 97 is not present in the table.
2. **Cascading Error:** This initial misidentification of the maximum value leads to an incorrect calculation of the range (16) in Steps 3 and 4. The correct range, using the table's data, would be 93 (max) - 81 (min) = 12.
3. **Error Labeling:** The solution's steps are explicitly marked as "(Incorrect)" in red text, indicating the provided solution is intentionally flawed, likely as a teaching example.
4. **Spelling:** The city name "Pleasent Town" appears to be a misspelling of "Pleasant Town."
### Interpretation
This image serves as a pedagogical tool demonstrating a common error in data analysis: misreading or misrepresenting source data. The core factual data is contained in the table on the left. The narrative on the right shows a logical process (calculating range) that is correctly structured but fails at the data extraction step (Step-2), using a value (97) not supported by the provided dataset.
The "Neural" label on Step-0 suggests an AI or automated system initiated the problem-solving process. The subsequent "Incorrect" labels highlight where the reasoning diverged from the facts. This setup is likely designed to teach students to:
1. Carefully verify source data against any derived conclusions.
2. Understand that a correct method (range = max - min) can still produce a wrong answer if the input data is wrong.
3. Critically evaluate step-by-step solutions, even those generated by automated systems.
The notable anomaly is the introduction of the number 97 for "Penny Town" in the solution, which directly contradicts the table. This is the root cause of the error and the central teaching point of the example.