## Text-Based Data Table and Solution Analysis
### Overview
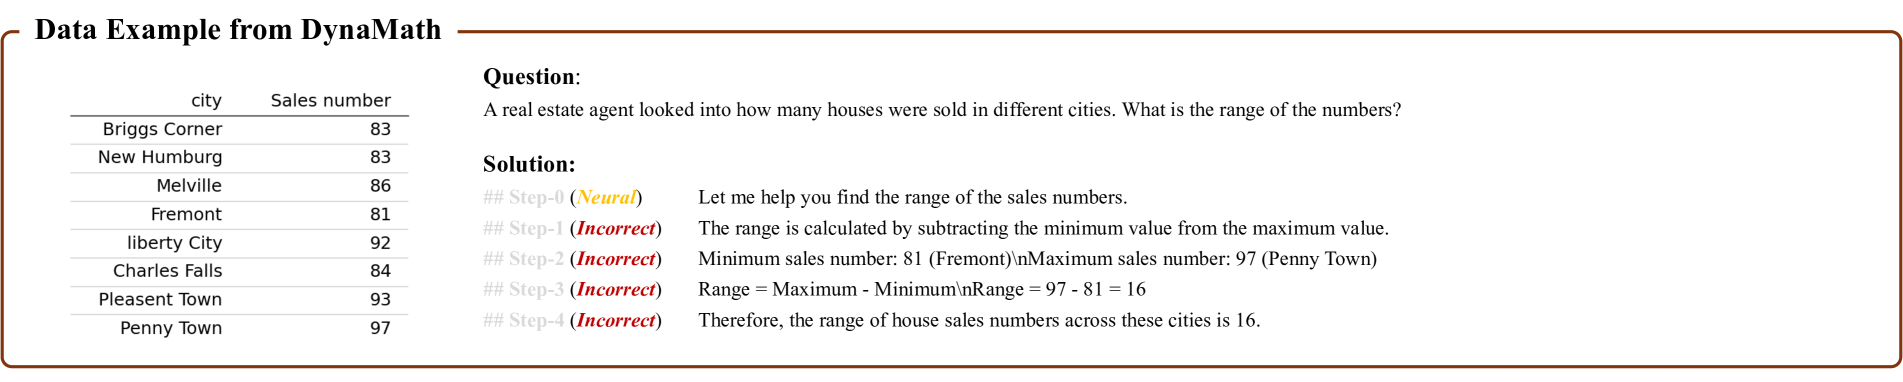
The image presents a data table listing sales numbers for eight cities, followed by a question about calculating the range of these numbers. A solution attempt is provided, containing labeled steps with some marked as "Incorrect."
### Components/Axes
- **Table Structure**:
- **Headers**: `city`, `Sales number`
- **Rows**: Eight cities with corresponding sales numbers (all values are integers).
- **Question**: "A real estate agent looked into how many houses were sold in different cities. What is the range of the numbers?"
- **Solution Section**:
- **Steps**: Labeled `#Step-0` to `#Step-4`, with `#Step-0` marked as "Neural" and `#Step-1` to `#Step-4` marked as "Incorrect."
- **Text Content**: Step-by-step explanation of calculating the range, including intermediate values and a final answer.
### Detailed Analysis
#### Table Data
| City | Sales Number |
|-----------------|--------------|
| Briggs Corner | 83 |
| New Humburg | 83 |
| Melville | 86 |
| Fremont | 81 |
| Liberty City | 92 |
| Charles Falls | 84 |
| Pleasant Town | 93 |
| Penny Town | 97 |
#### Solution Steps
1. **Step 0 (Neural)**: "Let me help you find the range of the sales numbers."
2. **Step 1 (Incorrect)**: "The range is calculated by subtracting the minimum value from the maximum value."
3. **Step 2 (Incorrect)**: "Minimum sales number: 81 (Fremont)\nMaximum sales number: 97 (Penny Town)"
4. **Step 3 (Incorrect)**: "Range = Maximum - Minimum\nRange = 97 - 81 = 16"
5. **Step 4 (Incorrect)**: "Therefore, the range of house sales numbers across these cities is 16."
### Key Observations
- The table lists sales numbers for eight cities, with values ranging from 81 (Fremont) to 97 (Penny Town).
- The solution correctly identifies the minimum (81) and maximum (97) sales numbers and calculates the range as 16. However, all steps after Step 0 are labeled as "Incorrect," despite the final answer being accurate. This suggests a potential inconsistency in the labeling of steps.
### Interpretation
- **Data Trends**: The sales numbers are clustered between 81 and 97, with no extreme outliers. The range (16) indicates moderate variability in sales across cities.
- **Solution Analysis**: While the mathematical steps (Steps 1–4) are factually correct, their labeling as "Incorrect" is contradictory. This could imply an error in the problem's annotation or a misalignment between the steps and their labels. The final answer (range = 16) is valid based on the provided data.
- **Notable Anomaly**: The labeling of Steps 1–4 as "Incorrect" conflicts with the accuracy of their content. This discrepancy warrants further investigation into the source of the error (e.g., mislabeling, contextual misunderstanding of "range").