\n
## Line Chart: Accuracy vs. Sample Size
### Overview
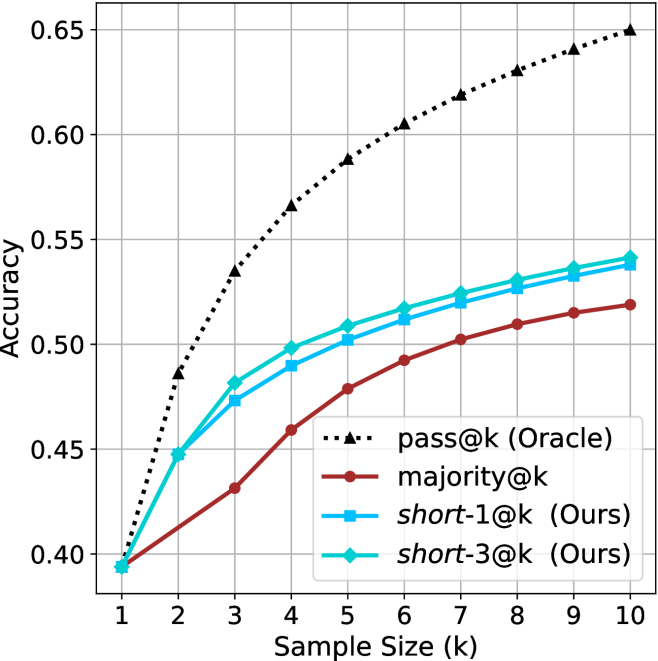
This image presents a line chart illustrating the relationship between accuracy and sample size (k) for different methods. The chart compares the performance of "pass@k (Oracle)", "majority@k", "short-1@k (Ours)", and "short-3@k (Ours)" methods. The x-axis represents the sample size (k), ranging from 1 to 10, while the y-axis represents the accuracy, ranging from 0.40 to 0.65.
### Components/Axes
* **X-axis Label:** "Sample Size (k)"
* **Y-axis Label:** "Accuracy"
* **Lines/Legends:**
* "pass@k (Oracle)" - Black dotted line
* "majority@k" - Brown solid line
* "short-1@k (Ours)" - Blue solid line with triangle markers
* "short-3@k (Ours)" - Light blue solid line with circle markers
* **Gridlines:** A grid is present to aid in reading values.
* **Legend Position:** Bottom-left corner.
### Detailed Analysis
The chart displays the accuracy of each method as the sample size increases.
* **pass@k (Oracle):** This line starts at approximately 0.41 at k=1 and increases rapidly, reaching approximately 0.64 at k=10. The line exhibits a steep upward slope, indicating a strong positive correlation between sample size and accuracy.
* **majority@k:** This line begins at approximately 0.40 at k=1 and increases steadily, reaching approximately 0.54 at k=10. The slope is less steep than "pass@k (Oracle)", indicating a slower increase in accuracy with sample size.
* **short-1@k (Ours):** This line starts at approximately 0.40 at k=1 and increases, reaching approximately 0.52 at k=10. The line shows a moderate increase in accuracy, with a slightly diminishing slope as k increases.
* **short-3@k (Ours):** This line begins at approximately 0.40 at k=1 and increases, reaching approximately 0.54 at k=10. The line shows a moderate increase in accuracy, similar to "short-1@k (Ours)", but consistently higher.
Here's a more detailed breakdown of data points (approximate):
| Sample Size (k) | pass@k (Oracle) | majority@k | short-1@k (Ours) | short-3@k (Ours) |
|---|---|---|---|---|
| 1 | 0.41 | 0.40 | 0.40 | 0.40 |
| 2 | 0.50 | 0.42 | 0.44 | 0.45 |
| 3 | 0.58 | 0.46 | 0.48 | 0.50 |
| 4 | 0.61 | 0.48 | 0.50 | 0.52 |
| 5 | 0.62 | 0.50 | 0.51 | 0.53 |
| 6 | 0.62 | 0.51 | 0.52 | 0.53 |
| 7 | 0.63 | 0.52 | 0.52 | 0.54 |
| 8 | 0.63 | 0.53 | 0.53 | 0.54 |
| 9 | 0.64 | 0.53 | 0.53 | 0.54 |
| 10 | 0.64 | 0.54 | 0.52 | 0.54 |
### Key Observations
* "pass@k (Oracle)" consistently outperforms all other methods across all sample sizes.
* "short-3@k (Ours)" performs better than "short-1@k (Ours)" for all sample sizes.
* The accuracy gains diminish as the sample size increases for all methods.
* "majority@k" shows a relatively slow increase in accuracy compared to the other methods.
### Interpretation
The chart demonstrates the impact of sample size on the accuracy of different methods for a given task. The "pass@k (Oracle)" method, which likely represents an ideal or upper-bound performance, serves as a benchmark. The "short-1@k (Ours)" and "short-3@k (Ours)" methods represent proposed approaches ("Ours"), and their performance is compared to the benchmark and the "majority@k" method.
The fact that "short-3@k (Ours)" consistently outperforms "short-1@k (Ours)" suggests that incorporating more information (potentially through the "3" in "short-3") improves accuracy. The diminishing returns in accuracy as sample size increases indicate that there's a point where adding more data provides limited additional benefit. The relatively low performance of "majority@k" suggests that a simple majority voting approach is less effective than the proposed "short" methods.
The chart suggests that the proposed "short" methods are promising alternatives, approaching the performance of the "Oracle" method, especially as the sample size increases. The difference between the "Oracle" and the "short" methods could be due to limitations in the proposed algorithms or the inherent complexity of the task.