## Line Graph: Accuracy vs. Sample Size (k)
### Overview
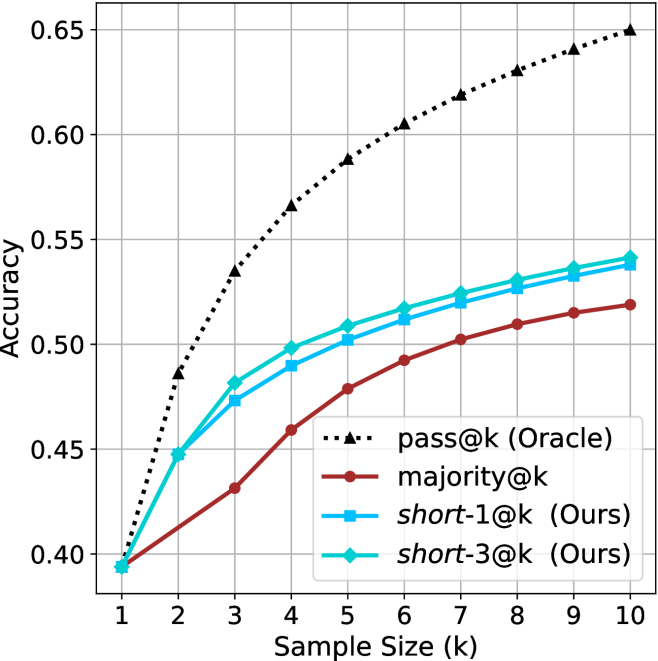
The image is a line graph comparing the accuracy of four different methods across varying sample sizes (k = 1 to 10). The y-axis represents accuracy (0.40 to 0.65), and the x-axis represents sample size (k). Four data series are plotted: "pass@k (Oracle)", "majority@k", "short-1@k (Ours)", and "short-3@k (Ours)". The graph shows trends in accuracy as sample size increases.
### Components/Axes
- **X-axis (Sample Size, k)**: Labeled "Sample Size (k)" with integer markers from 1 to 10.
- **Y-axis (Accuracy)**: Labeled "Accuracy" with increments of 0.05 from 0.40 to 0.65.
- **Legend**: Located on the right side of the graph. Colors and markers:
- **pass@k (Oracle)**: Dotted line with triangular markers (black).
- **majority@k**: Solid red line.
- **short-1@k (Ours)**: Solid blue line.
- **short-3@k (Ours)**: Solid green line.
### Detailed Analysis
1. **pass@k (Oracle)**:
- Starts at 0.40 when k=1.
- Increases steadily, reaching 0.65 at k=10.
- Slope is the steepest among all lines.
2. **majority@k**:
- Starts at 0.40 when k=1.
- Rises gradually to 0.52 at k=10.
- Slope is the shallowest among the non-Oracle lines.
3. **short-1@k (Ours)**:
- Starts at 0.40 when k=1.
- Increases to 0.54 at k=10.
- Slope is steeper than majority@k but less than pass@k.
4. **short-3@k (Ours)**:
- Starts at 0.40 when k=1.
- Rises to 0.54 at k=10, with a slight increase to 0.55 at k=10.
- Slope is similar to short-1@k but slightly higher at k=10.
### Key Observations
- All lines start at the same accuracy (0.40) when k=1.
- **pass@k (Oracle)** consistently outperforms all other methods across all sample sizes.
- **short-3@k (Ours)** and **short-1@k (Ours)** show similar performance, with short-3@k slightly outperforming short-1@k at k=10.
- **majority@k** remains the lowest-performing method throughout the range.
### Interpretation
The data suggests that the **pass@k (Oracle)** method achieves the highest accuracy as sample size increases, indicating it is the most effective approach. The "Ours" methods (short-1@k and short-3@k) perform better than the majority@k baseline but do not match the Oracle's performance. The gap between the Oracle and the other methods narrows as sample size increases, implying that larger sample sizes improve accuracy for all methods, though the Oracle maintains a clear advantage. The short-3@k method appears to be the most effective among the "Ours" approaches, suggesting potential optimizations in its design compared to short-1@k.