## Line Charts: Threshold ITD and IID vs. Signal Frequency
### Overview
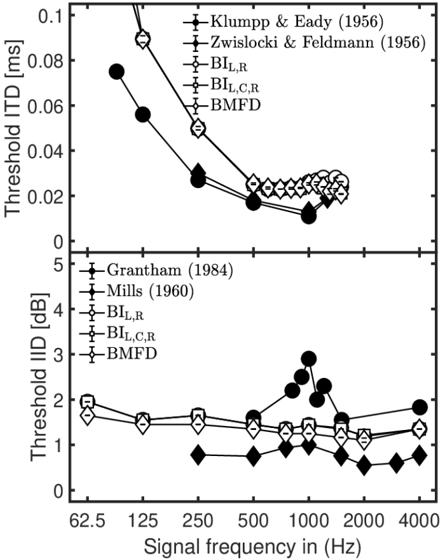
The image presents two line charts stacked vertically. The top chart displays the threshold Interaural Time Difference (ITD) in milliseconds (ms) as a function of signal frequency in Hertz (Hz). The bottom chart shows the threshold Interaural Intensity Difference (IID) in decibels (dB) against signal frequency in Hz. Each chart contains multiple data series representing different studies or conditions.
### Components/Axes
**Top Chart (Threshold ITD):**
* **Y-axis:** Threshold ITD [ms], ranging from 0 to 0.1. Markers at 0, 0.02, 0.04, 0.06, 0.08, and 0.1.
* **X-axis:** Signal frequency in (Hz), ranging from 62.5 to 4000 (shared with the bottom chart). Markers at 62.5, 125, 250, 500, 1000, 2000, and 4000.
* **Legend (Top-Right):**
* Black circle with error bars: Klumpp & Eady (1956)
* Plus sign: Zwislocki & Feldmann (1956)
* White circle: BI<sub>L,R</sub>
* Plus sign with horizontal bar: BI<sub>L,C,R</sub>
* White diamond with horizontal bar: BMFD
**Bottom Chart (Threshold IID):**
* **Y-axis:** Threshold IID [dB], ranging from 0 to 5. Markers at 0, 1, 2, 3, 4, and 5.
* **X-axis:** Signal frequency in (Hz), ranging from 62.5 to 4000 (shared with the top chart). Markers at 62.5, 125, 250, 500, 1000, 2000, and 4000.
* **Legend (Top-Left):**
* Black circle with error bars: Grantham (1984)
* Plus sign: Mills (1960)
* White circle: BI<sub>L,R</sub>
* Plus sign with horizontal bar: BI<sub>L,C,R</sub>
* White diamond with horizontal bar: BMFD
### Detailed Analysis
**Top Chart (Threshold ITD):**
* **Klumpp & Eady (1956):** Starts at approximately 0.075 ms at 62.5 Hz, decreases sharply to about 0.03 ms at 250 Hz, and then gradually decreases to approximately 0.015 ms at 4000 Hz.
* **Zwislocki & Feldmann (1956):** Starts at approximately 0.09 ms at 62.5 Hz, decreases sharply to about 0.028 ms at 250 Hz, and then gradually decreases to approximately 0.012 ms at 4000 Hz.
* **BI<sub>L,R</sub>:** Starts at approximately 0.095 ms at 62.5 Hz, decreases sharply to about 0.03 ms at 250 Hz, and then remains relatively constant around 0.02-0.025 ms from 500 Hz to 4000 Hz.
* **BI<sub>L,C,R</sub>:** Starts at approximately 0.09 ms at 62.5 Hz, decreases sharply to about 0.028 ms at 250 Hz, and then remains relatively constant around 0.02-0.025 ms from 500 Hz to 4000 Hz.
* **BMFD:** Starts at approximately 0.07 ms at 62.5 Hz, decreases sharply to about 0.035 ms at 250 Hz, and then remains relatively constant around 0.018-0.02 ms from 500 Hz to 4000 Hz.
**Bottom Chart (Threshold IID):**
* **Grantham (1984):** Starts at approximately 1.8 dB at 62.5 Hz, remains relatively constant around 1.5-1.8 dB until 500 Hz, then increases sharply to approximately 2.8 dB at 1000 Hz, and then decreases to approximately 1.8 dB at 4000 Hz.
* **Mills (1960):** Starts at approximately 1.7 dB at 62.5 Hz, decreases to approximately 0.7 dB at 500 Hz, then increases to approximately 1.2 dB at 4000 Hz.
* **BI<sub>L,R</sub>:** Starts at approximately 2 dB at 62.5 Hz, decreases slightly to approximately 1.3 dB at 250 Hz, then increases slightly and remains relatively constant around 1.4-1.6 dB from 500 Hz to 4000 Hz.
* **BI<sub>L,C,R</sub>:** Starts at approximately 1.8 dB at 62.5 Hz, decreases slightly to approximately 1.3 dB at 250 Hz, then increases slightly and remains relatively constant around 1.3-1.5 dB from 500 Hz to 4000 Hz.
* **BMFD:** Starts at approximately 1.7 dB at 62.5 Hz, decreases slightly to approximately 1.1 dB at 250 Hz, then increases slightly and remains relatively constant around 0.7-1.0 dB from 500 Hz to 4000 Hz.
### Key Observations
* In the top chart (ITD), all data series show a decreasing trend as signal frequency increases, with a sharp drop between 62.5 Hz and 250 Hz. After 250 Hz, the ITD thresholds tend to stabilize.
* In the bottom chart (IID), the data series show more variability. Grantham (1984) exhibits a peak around 1000 Hz. The other series are relatively flat, with Mills (1960) showing a decreasing trend up to 500 Hz.
* The BI<sub>L,R</sub> and BI<sub>L,C,R</sub> series are very similar in both charts.
### Interpretation
The charts illustrate the relationship between signal frequency and the thresholds for detecting interaural time differences (ITD) and interaural intensity differences (IID). The data suggests that sensitivity to ITD is higher at lower frequencies, as indicated by the decreasing thresholds with increasing frequency. The IID thresholds show more complex patterns, with some studies indicating a peak in sensitivity around 1000 Hz. The similarity between BI<sub>L,R</sub> and BI<sub>L,C,R</sub> suggests that the conditions they represent have similar effects on auditory perception of ITD and IID. The different studies (Klumpp & Eady, Zwislocki & Feldmann, Grantham, Mills) show variations in the absolute threshold values, which could be attributed to differences in experimental methodologies or subject populations.