\n
## Chart: Threshold vs. Signal Frequency for Temporal and Interaural Differences
### Overview
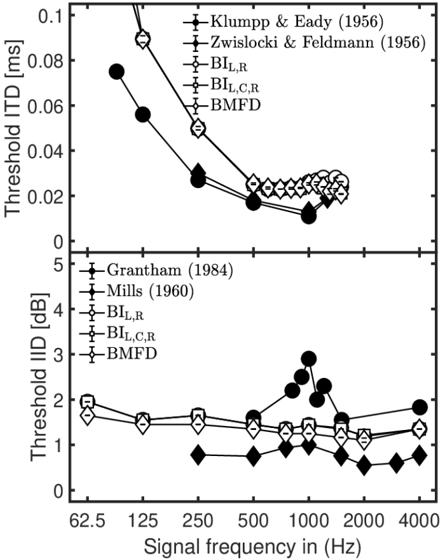
The image presents a dual-panel chart illustrating the relationship between signal frequency and threshold values for Temporal Difference (TD) and Interaural Intensity Difference (IID). The top panel displays Threshold TD [ms] against Signal frequency [Hz], while the bottom panel shows Threshold IID [dB] against Signal frequency [Hz]. Multiple data series, representing different studies, are plotted on each panel.
### Components/Axes
* **X-axis (Both Panels):** Signal frequency in Hz. Scale ranges from approximately 62.5 Hz to 4000 Hz. Markers are placed at 62.5, 125, 250, 500, 1000, 2000, and 4000 Hz.
* **Y-axis (Top Panel):** Threshold TD [ms]. Scale ranges from 0 to 0.1 ms.
* **Y-axis (Bottom Panel):** Threshold IID [dB]. Scale ranges from 0 to 5 dB.
* **Legend (Top-Left):**
* Klump & Eady (1956) - Black circles with error bars.
* Zwislocki & Feldmann (1956) - Black squares with error bars.
* BILR - Black triangles pointing up with error bars.
* BILC,R - Black diamonds with error bars.
* BMFD - Black triangles pointing down with error bars.
* **Legend (Bottom-Left):**
* Grantham (1984) - Black circles with error bars.
* Mills (1960) - Black squares with error bars.
* BILR - Black triangles pointing up with error bars.
* BILC,R - Black diamonds with error bars.
* BMFD - Black triangles pointing down with error bars.
### Detailed Analysis or Content Details
**Top Panel (Threshold TD vs. Signal Frequency):**
* **Klump & Eady (1956):** The line starts at approximately 0.09 ms at 62.5 Hz, decreases rapidly to around 0.025 ms at 250 Hz, and then plateaus around 0.02 ms for frequencies above 500 Hz.
* **Zwislocki & Feldmann (1956):** The line begins at approximately 0.085 ms at 62.5 Hz, decreases to around 0.03 ms at 250 Hz, and then levels off around 0.02 ms for frequencies above 500 Hz.
* **BILR:** The line starts at approximately 0.07 ms at 62.5 Hz, decreases to around 0.025 ms at 250 Hz, and then remains relatively constant around 0.02 ms for higher frequencies.
* **BILC,R:** The line begins at approximately 0.065 ms at 62.5 Hz, decreases to around 0.02 ms at 250 Hz, and then plateaus around 0.018 ms for frequencies above 500 Hz.
* **BMFD:** The line starts at approximately 0.06 ms at 62.5 Hz, decreases to around 0.02 ms at 250 Hz, and then remains relatively constant around 0.018 ms for higher frequencies.
**Bottom Panel (Threshold IID vs. Signal Frequency):**
* **Grantham (1984):** The line starts at approximately 2.2 dB at 62.5 Hz, decreases to around 1.5 dB at 250 Hz, increases to approximately 2.2 dB at 1000 Hz, and then decreases slightly to around 2 dB at 4000 Hz.
* **Mills (1960):** The line begins at approximately 1.8 dB at 62.5 Hz, remains relatively constant around 1.5 dB up to 500 Hz, and then increases to around 2 dB at 2000 Hz, decreasing to approximately 1.8 dB at 4000 Hz.
* **BILR:** The line starts at approximately 1.5 dB at 62.5 Hz, remains relatively constant around 1.2 dB up to 1000 Hz, and then increases to around 1.8 dB at 4000 Hz.
* **BILC,R:** The line begins at approximately 1.2 dB at 62.5 Hz, remains relatively constant around 1 dB up to 1000 Hz, and then increases to around 1.6 dB at 4000 Hz.
* **BMFD:** The line starts at approximately 1.0 dB at 62.5 Hz, remains relatively constant around 0.8 dB up to 1000 Hz, and then increases to around 1.4 dB at 4000 Hz.
### Key Observations
* In the top panel, all data series show a similar trend: a rapid decrease in Threshold TD with increasing signal frequency up to 250 Hz, followed by a plateau.
* In the bottom panel, the Threshold IID values are generally lower than the Threshold TD values. The lines exhibit more fluctuation, but generally show a slight increase with increasing signal frequency.
* The data from Klump & Eady (1956) and Zwislocki & Feldmann (1956) are very close to each other in the top panel.
* The BMFD and BILC,R lines are consistently lower than the other lines in both panels.
### Interpretation
The chart demonstrates the frequency dependence of auditory thresholds for detecting temporal and interaural differences. The rapid decrease in Threshold TD at lower frequencies suggests that humans are more sensitive to temporal differences at lower frequencies. The plateau at higher frequencies indicates a limit to this sensitivity. The relatively stable Threshold IID values suggest a consistent ability to detect interaural intensity differences across the frequency spectrum, with a slight improvement at higher frequencies.
The consistency between the studies of Klump & Eady and Zwislocki & Feldmann suggests a robust finding regarding temporal thresholds. The differences between the data series likely reflect variations in experimental methodology or subject populations. The lower thresholds for BMFD and BILC,R may indicate a specific sensitivity related to the binaural processing mechanisms being investigated in those studies.
The chart provides valuable insights into the mechanisms of sound localization and the neural processing of auditory information. The data supports the idea that the auditory system utilizes both temporal and interaural cues to determine the location of sound sources, and that the relative importance of these cues varies with frequency.