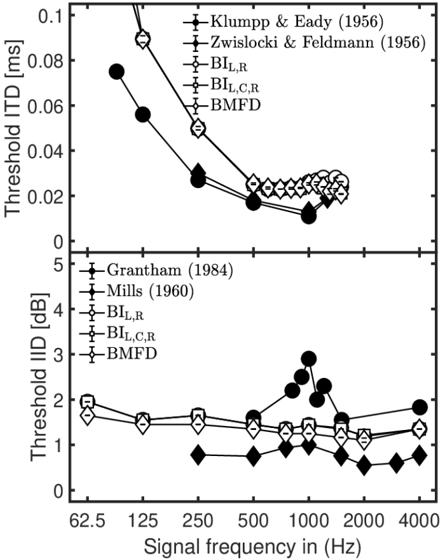
## Line Graph: Threshold ITD and IID Across Signal Frequencies
### Overview
The image contains two vertically stacked line graphs comparing threshold values for Interaural Time Difference (ITD) and Interaural Intensity Difference (IID) across a range of signal frequencies (62.5 Hz to 4000 Hz). The top panel shows threshold ITD in milliseconds (ms), while the bottom panel shows threshold IID in decibels (dB). Multiple data series are plotted, each representing different studies or models (e.g., Klumpp & Eady, 1956; Zwislocki & Feldmann, 1956; BI_L,R; BI_L,C,R; BMFD).
### Components/Axes
- **X-axis**: Signal frequency in Hz (62.5, 125, 250, 500, 1000, 2000, 4000).
- **Y-axis (Top Panel)**: Threshold ITD in ms (0 to 0.1).
- **Y-axis (Bottom Panel)**: Threshold IID in dB (0 to 5).
- **Legends**:
- **Top Panel**:
- Klumpp & Eady (1956): Black circles with error bars.
- Zwislocki & Feldmann (1956): Black diamonds with error bars.
- BI_L,R: Open circles.
- BI_L,C,R: Open squares.
- BMFD: Open diamonds.
- **Bottom Panel**:
- Grantham (1984): Black circles with error bars.
- Mills (1960): Black diamonds with error bars.
- BI_L,R: Open circles.
- BI_L,C,R: Open squares.
- BMFD: Open diamonds.
### Detailed Analysis
#### Top Panel (Threshold ITD)
- **Klumpp & Eady (1956)**: Starts at ~0.08 ms at 62.5 Hz, decreases sharply to ~0.02 ms at 4000 Hz.
- **Zwislocki & Feldmann (1956)**: Begins at ~0.06 ms at 62.5 Hz, declines to ~0.02 ms at 4000 Hz.
- **BI_L,R**: Starts at ~0.07 ms, drops to ~0.02 ms.
- **BI_L,C,R**: Similar trend to BI_L,R but slightly higher at lower frequencies.
- **BMFD**: Starts at ~0.06 ms, converges with other series at higher frequencies.
#### Bottom Panel (Threshold IID)
- **Grantham (1984)**: Starts at ~2 dB, remains relatively flat (~1.5–2 dB) across frequencies.
- **Mills (1960)**: Peaks at ~3 dB at 62.5 Hz, dips to ~1 dB at 4000 Hz.
- **BI_L,R**: Starts at ~2 dB, decreases to ~1 dB.
- **BI_L,C,R**: Similar to BI_L,R but slightly higher at lower frequencies.
- **BMFD**: Starts at ~1.5 dB, remains stable (~1–1.5 dB).
### Key Observations
1. **Frequency Dependence**: Both ITD and IID thresholds generally decrease with increasing frequency, suggesting better auditory localization at higher frequencies.
2. **Convergence**: Most data series converge at higher frequencies (2000–4000 Hz), indicating agreement across studies/models at these ranges.
3. **Anomalies**:
- Mills (1960) shows a peak in IID at 62.5 Hz, diverging from the general trend.
- BI_L,C,R consistently exhibits slightly higher thresholds than BI_L,R in both panels.
4. **Model Variations**: BMFD and BI_L,R show the smallest thresholds, while older studies (e.g., Klumpp & Eady) have higher values.
### Interpretation
The data demonstrates a clear trend where auditory localization thresholds (ITD and IID) improve with higher signal frequencies, likely due to enhanced temporal and spectral resolution in the auditory system. The convergence of modern models (BI_L,R, BI_L,C,R, BMFD) at higher frequencies suggests these frameworks better capture the physiological mechanisms of sound localization. Older studies (e.g., Klumpp & Eady, Mills) exhibit higher thresholds, possibly reflecting limitations in experimental design or theoretical assumptions. The anomaly in Mills (1960) for IID at low frequencies may indicate unique experimental conditions or species-specific differences. Overall, the graphs highlight the importance of frequency in auditory processing and the evolution of modeling approaches over time.