## Spectrogram: Environmental Sound Analysis
### Overview
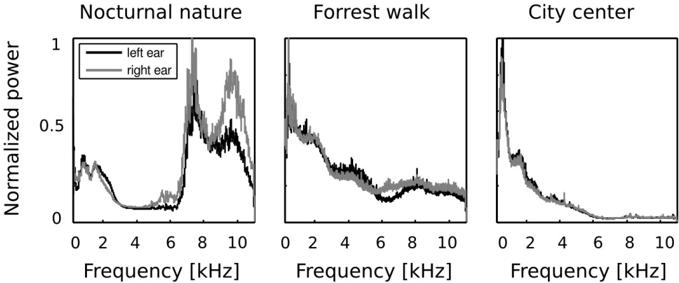
The image presents three spectrograms, each representing the normalized power of sound frequencies in different environments: "Nocturnal nature," "Forrest walk," and "City center." Each spectrogram displays two lines, representing the sound perceived by the left and right ears. The x-axis represents frequency in kHz, ranging from 0 to 10 kHz, and the y-axis represents normalized power, ranging from 0 to 1.
### Components/Axes
* **Titles (Top):**
* Nocturnal nature
* Forrest walk
* City center
* **Y-axis:**
* Label: Normalized power
* Scale: 0 to 1, with markers at 0, 0.5, and 1.
* **X-axis:**
* Label: Frequency [kHz]
* Scale: 0 to 10 kHz, with markers at every 2 kHz.
* **Legend (Top-Left of the first chart):**
* Black line: left ear
* Gray line: right ear
### Detailed Analysis
**1. Nocturnal Nature**
* **Left Ear (Black):** The power is low from 0 to approximately 6 kHz, then rises sharply to a peak around 8 kHz with a normalized power of approximately 0.45, then decreases and rises again to a peak around 9.5 kHz with a normalized power of approximately 0.55.
* **Right Ear (Gray):** The power is low from 0 to approximately 6 kHz, then rises sharply to a peak around 8 kHz with a normalized power of approximately 0.75, then decreases and rises again to a peak around 9.5 kHz with a normalized power of approximately 0.85.
**2. Forrest Walk**
* **Left Ear (Black):** The power starts high at 0 kHz with a normalized power of approximately 0.4, then gradually decreases to approximately 0.15 at 10 kHz.
* **Right Ear (Gray):** The power starts high at 0 kHz with a normalized power of approximately 0.5, then gradually decreases to approximately 0.2 at 10 kHz.
**3. City Center**
* **Left Ear (Black):** The power rises sharply from 0 kHz to a peak around 1 kHz with a normalized power of approximately 0.8, then decreases rapidly to approximately 0.05 at 4 kHz, and remains low until 10 kHz.
* **Right Ear (Gray):** The power rises sharply from 0 kHz to a peak around 1 kHz with a normalized power of approximately 0.9, then decreases rapidly to approximately 0.05 at 4 kHz, and remains low until 10 kHz.
### Key Observations
* **Nocturnal Nature:** Shows distinct peaks in the higher frequency range (around 8-10 kHz), with the right ear consistently registering higher power than the left ear in this range.
* **Forrest Walk:** Exhibits a gradual decrease in power across the frequency spectrum for both ears, with the right ear consistently registering higher power than the left ear.
* **City Center:** Displays a sharp peak in the lower frequency range (around 1 kHz), with a rapid decline in power as frequency increases. The power levels for both ears are very similar.
### Interpretation
The spectrograms provide insights into the soundscapes of different environments.
* **Nocturnal Nature:** The peaks in the higher frequency range likely represent sounds of insects or other nocturnal animals. The difference in power between the left and right ears could indicate the directionality of these sounds.
* **Forrest Walk:** The gradual decrease in power suggests a broad range of sounds, possibly including wind, rustling leaves, and distant animal calls. The higher power in the right ear could be due to the listener's position relative to the sound sources.
* **City Center:** The sharp peak in the lower frequency range likely represents traffic noise, construction, or other urban sounds. The similarity in power between the left and right ears suggests that these sounds are omnidirectional or coming from a distance.
The data suggests that each environment has a unique sound signature, characterized by different frequency distributions and power levels. These differences can be attributed to the specific sound sources present in each environment.