\n
## Chart: Sound Power Spectral Density in Different Environments
### Overview
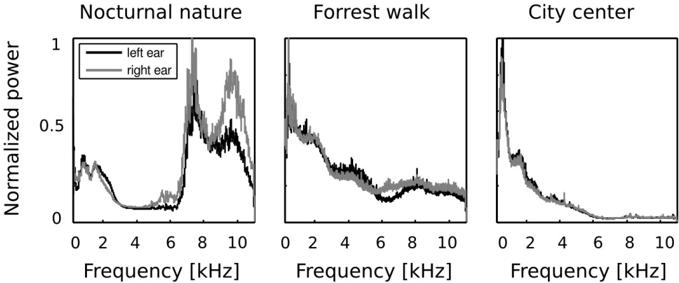
The image presents three line charts, each representing the normalized power spectral density of sound as a function of frequency, measured in the left and right ears. The three environments are "Nocturnal nature", "Forrest walk", and "City center". Each chart displays two lines: one for the left ear (black) and one for the right ear (grey).
### Components/Axes
* **X-axis:** Frequency [kHz], ranging from 0 to 10 kHz.
* **Y-axis:** Normalized power, ranging from 0 to 1.
* **Legend:** Located in the top-left corner of each chart.
* Black line: "left ear"
* Grey line: "right ear"
* **Titles:** Each chart has a title indicating the environment: "Nocturnal nature", "Forrest walk", and "City center", positioned above the respective chart.
### Detailed Analysis or Content Details
**1. Nocturnal Nature:**
* **Trend:** Both lines (left and right ear) show a generally increasing trend from 0 kHz to approximately 8 kHz, followed by a decrease. There's a prominent peak around 8-9 kHz.
* **Data Points (approximate):**
* Left Ear:
* 0 kHz: ~0.1
* 2 kHz: ~0.25
* 4 kHz: ~0.4
* 6 kHz: ~0.6
* 8 kHz: ~0.8
* 10 kHz: ~0.6
* Right Ear:
* 0 kHz: ~0.1
* 2 kHz: ~0.2
* 4 kHz: ~0.35
* 6 kHz: ~0.55
* 8 kHz: ~0.75
* 10 kHz: ~0.55
**2. Forrest Walk:**
* **Trend:** Both lines show a decreasing trend across the entire frequency range. The decrease is more pronounced at lower frequencies.
* **Data Points (approximate):**
* Left Ear:
* 0 kHz: ~0.4
* 2 kHz: ~0.3
* 4 kHz: ~0.2
* 6 kHz: ~0.15
* 8 kHz: ~0.1
* 10 kHz: ~0.05
* Right Ear:
* 0 kHz: ~0.35
* 2 kHz: ~0.25
* 4 kHz: ~0.18
* 6 kHz: ~0.12
* 8 kHz: ~0.08
* 10 kHz: ~0.04
**3. City Center:**
* **Trend:** Both lines show a rapid decrease in normalized power from 0 kHz to approximately 2 kHz, then leveling off at a very low value.
* **Data Points (approximate):**
* Left Ear:
* 0 kHz: ~0.3
* 2 kHz: ~0.1
* 4 kHz: ~0.05
* 6 kHz: ~0.03
* 8 kHz: ~0.02
* 10 kHz: ~0.02
* Right Ear:
* 0 kHz: ~0.25
* 2 kHz: ~0.08
* 4 kHz: ~0.04
* 6 kHz: ~0.02
* 8 kHz: ~0.01
* 10 kHz: ~0.01
### Key Observations
* The "Nocturnal nature" environment exhibits the highest overall sound power, particularly in the higher frequency range (8-10 kHz).
* The "Forrest walk" environment has moderate sound power, decreasing steadily with increasing frequency.
* The "City center" environment has the lowest sound power, with a sharp drop-off at lower frequencies.
* In all three environments, the left and right ear measurements are relatively close, suggesting a symmetrical sound field.
### Interpretation
The charts demonstrate how the soundscape varies significantly depending on the environment. The "Nocturnal nature" environment, likely containing sounds from insects, animals, and wind, has a broader frequency spectrum and higher power, especially at higher frequencies. The "Forrest walk" environment, with sounds like rustling leaves and bird calls, has a more subdued sound profile. The "City center" environment, dominated by traffic and human activity, is characterized by low-frequency sounds that are quickly attenuated, resulting in a very low overall sound power at higher frequencies.
The similarity between the left and right ear measurements suggests that the sound sources are relatively diffuse in all three environments, meaning the sound is coming from multiple directions rather than a single, localized source. This data could be used to assess the acoustic characteristics of different environments and their potential impact on human hearing and well-being. The differences in spectral density could also be used to classify environments based on their acoustic signatures.