## Heatmap: KeyDiff vs Context Length
### Overview
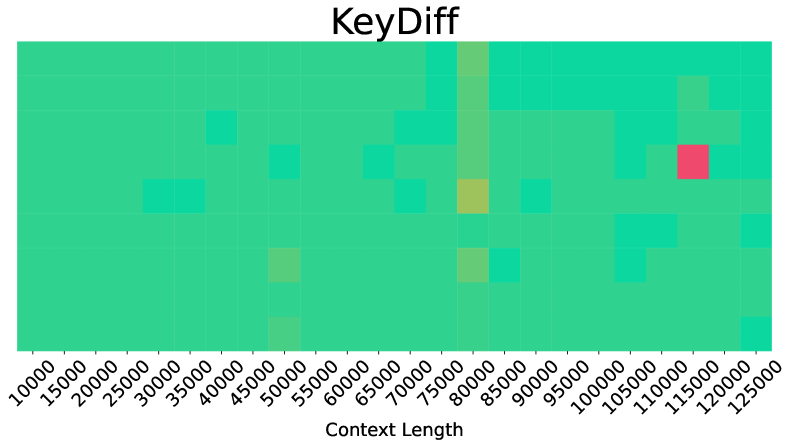
The image is a heatmap titled "KeyDiff," visualizing the relationship between "Context Length" (x-axis) and "KeyDiff" (y-axis). The grid uses varying shades of green, yellow, and red to represent data density or magnitude, with a prominent red square at (115k, 115k) and yellow squares at (80k, 80k) and (75k, 75k). The axes are labeled with numerical ranges, and the grid is structured as a 2D matrix.
---
### Components/Axes
- **X-axis (Context Length)**: Labeled with values from 10,000 to 125,000 in increments of 10,000.
- **Y-axis (KeyDiff)**: Labeled with values from 10,000 to 125,000 in increments of 10,000.
- **Grid**: A 2D matrix with cells colored in green, yellow, or red.
- **Legend**: Not explicitly visible, but colors likely correspond to KeyDiff magnitude (e.g., red = highest, green = lowest).
---
### Detailed Analysis
- **Red Square**: Located at (115,000, 115,000), indicating the highest KeyDiff value.
- **Yellow Squares**:
- (80,000, 80,000): Mid-range KeyDiff.
- (75,000, 75,000): Slightly lower than (80k, 80k).
- **Green Squares**: Scattered across the grid, representing lower KeyDiff values.
- **Distribution**:
- Higher KeyDiff values cluster around (115k, 115k) and (80k–75k).
- Lower KeyDiff values are more evenly distributed in the lower-left and upper-right regions.
---
### Key Observations
1. **Outlier**: The red square at (115k, 115k) is the most significant data point, suggesting an extreme KeyDiff at this context length.
2. **Mid-Range Clustering**: Yellow squares at (80k, 80k) and (75k, 75k) indicate moderate KeyDiff values concentrated at these points.
3. **Low-Value Spread**: Green squares are dispersed, implying lower KeyDiff across most of the grid.
4. **Symmetry**: The red and yellow squares align diagonally, suggesting a potential correlation between Context Length and KeyDiff.
---
### Interpretation
- **Trend**: KeyDiff increases with Context Length up to 115k, where it peaks (red square). Beyond this, KeyDiff may decrease or stabilize, as seen in the green-dominated upper-right region.
- **Significance**: The red square at (115k, 115k) could represent a critical threshold or anomaly, warranting further investigation.
- **Mid-Range Relevance**: The yellow squares at (80k–75k) suggest these context lengths are important for moderate KeyDiff, possibly indicating optimal or balanced performance.
- **Anomalies**: The absence of red/yellow squares in the lower-left and upper-right regions implies lower KeyDiff in those ranges, which might indicate less impactful or stable conditions.
This heatmap highlights how KeyDiff varies with Context Length, emphasizing specific points of interest for further analysis.