## Diagram: Hierarchical Process Flow with Decision Paths
### Overview
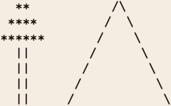
The image depicts a technical diagram combining a hierarchical tree structure on the left with a dashed triangular flowchart on the right. The tree has three labeled levels (Level 1–3) with increasing asterisks, connected via dashed lines to a triangle labeled A–C. A legend maps colors to hierarchy levels, and the triangle’s edges are labeled "Path 1–3."
### Components/Axes
- **Left Tree Structure**:
- **Labels**: "Level 1", "Level 2", "Level 3" (vertical axis).
- **Markers**: Asterisks (*) increase per level (1, 3, 5).
- **Legend**:
- Blue: Level 1
- Green: Level 2
- Red: Level 3
- **Dashed Lines**: Connect each tree level to the triangle’s vertices (A, B, C).
- **Right Triangle Flowchart**:
- **Vertices**: Labeled A (top), B (bottom-left), C (bottom-right).
- **Edges**: Dashed lines labeled "Path 1", "Path 2", "Path 3" (connecting A–B, A–C, B–C).
- **Color Coding**: Matches the legend (blue, green, red for paths 1–3).
### Detailed Analysis
- **Tree Hierarchy**:
- Level 1: 1 asterisk (blue).
- Level 2: 3 asterisks (green).
- Level 3: 5 asterisks (red).
- Asterisk count suggests increasing complexity or steps per level.
- **Dashed Connections**:
- Each tree level connects to all triangle vertices (A, B, C), implying bidirectional or multi-path relationships.
- Dashed lines indicate optional or alternative routes between levels and paths.
- **Triangle Paths**:
- Path 1 (blue): Connects A–B.
- Path 2 (green): Connects A–C.
- Path 3 (red): Connects B–C.
- Path labels align with legend colors, confirming consistency.
### Key Observations
1. **Hierarchical Complexity**: The tree’s increasing asterisks imply escalating stages or decision points.
2. **Path Interconnectivity**: Dashed lines suggest non-linear progression between levels and paths.
3. **Color Consistency**: Legend colors (blue/green/red) directly map to both tree levels and triangle paths, ensuring clarity.
4. **Symmetry**: The triangle’s equal-side dashed lines may indicate equal weighting of paths.
### Interpretation
This diagram likely models a **multi-stage decision-making process** or **workflow**:
- **Tree Levels** represent hierarchical stages (e.g., planning, execution, review), with complexity growing at each step.
- **Dashed Lines** imply flexibility: users can transition between levels and paths non-sequentially.
- **Triangle Paths** (A–B–C) may symbolize outcomes, stakeholders, or sub-processes. For example:
- Path 1 (A–B): Primary workflow.
- Path 2 (A–C): Alternative route.
- Path 3 (B–C): Feedback loop or correction step.
- **Asterisk Growth**: The 1→3→5 asterisk pattern could reflect resource allocation, risk, or decision branches per level.
The diagram emphasizes **non-linear progression** and **interconnected decision points**, common in agile methodologies or systems engineering. The absence of numerical data suggests a conceptual rather than quantitative model.