## Line Graph: Cumulative Component Impact on Measured Value
### Overview
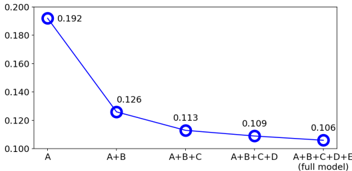
The image depicts a line graph illustrating a downward trend in a measured value as additional components (B, C, D, E) are added to a base component (A). The graph includes five data points connected by a blue line, with numerical values decreasing progressively from left to right. The x-axis represents incremental combinations of components, while the y-axis shows the measured value in decimal form. The final data point is labeled as the "full model" (A+B+C+D+E).
---
### Components/Axes
- **X-Axis (Horizontal)**:
- Labels: "A", "A+B", "A+B+C", "A+B+C+D", "A+B+C+D+E (full model)".
- Positioning: Left to right, with equal spacing between categories.
- **Y-Axis (Vertical)**:
- Labels: Numerical values ranging from 0.100 to 0.200 in increments of 0.020.
- Positioning: Top to bottom, with gridlines for reference.
- **Legend**:
- Not explicitly visible in the image. However, the blue line and circular markers are consistent with standard line graph conventions.
- **Data Points**:
- Blue circular markers with white centers, positioned at the following coordinates:
- (A, 0.192)
- (A+B, 0.126)
- (A+B+C, 0.113)
- (A+B+C+D, 0.109)
- (A+B+C+D+E, 0.106)
---
### Detailed Analysis
- **Trend**: The line graph shows a **consistent downward slope** from left to right, indicating a steady decline in the measured value as more components are added.
- **Data Points**:
- **A (0.192)**: Highest value, representing the base component alone.
- **A+B (0.126)**: A significant drop of 0.066 (34.8% decrease) from the base.
- **A+B+C (0.113)**: Further decrease of 0.013 (10.3% decrease) from A+B.
- **A+B+C+D (0.109)**: Minimal drop of 0.004 (3.5% decrease) from A+B+C.
- **Full Model (A+B+C+D+E, 0.106)**: Final value, a 0.003 (2.8% decrease) from the previous step.
- **Line Behavior**: The line connecting the points is smooth, suggesting a linear or near-linear relationship between component additions and the measured value.
---
### Key Observations
1. **Steep Initial Decline**: The largest drop occurs between "A" and "A+B", suggesting that adding component B has the most significant impact on reducing the measured value.
2. **Diminishing Returns**: Subsequent additions (C, D, E) result in progressively smaller reductions, indicating diminishing returns as more components are included.
3. **Full Model Value**: The final value (0.106) is the lowest, implying that the cumulative effect of all components maximizes the reduction in the measured metric.
---
### Interpretation
The graph demonstrates a **cumulative reduction effect** of adding components to a base system. The sharp decline after adding component B suggests it plays a critical role in lowering the measured value, while later components contribute less incrementally. This could imply:
- **Efficiency Gains**: If the measured value represents a cost or error rate, the full model achieves optimal performance.
- **Component Interactions**: The diminishing returns may indicate that later components have overlapping or redundant effects.
- **Model Robustness**: The full model’s value (0.106) is notably lower than the base (0.192), highlighting the importance of including all components for maximum impact.
The absence of a legend or explicit units for the y-axis limits contextual interpretation, but the trend itself is clear. The data suggests a systematic relationship between component inclusion and the target metric, with potential applications in optimization or system design.