## Comparative Analysis of RAG vs. Non-RAG Performance
### Overview
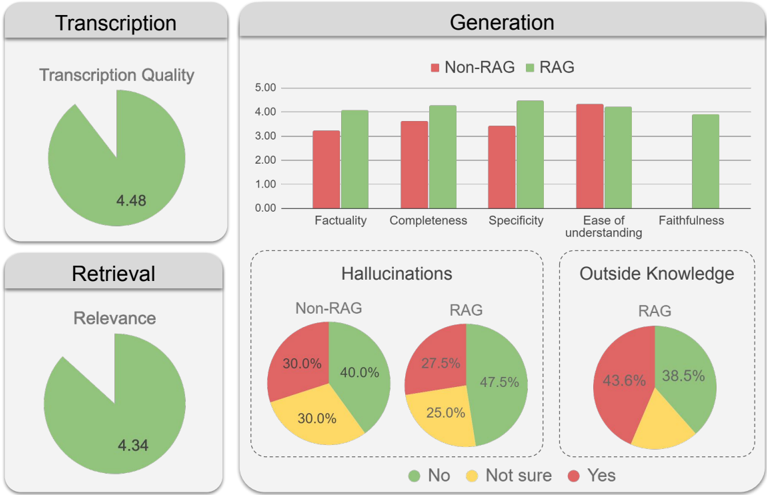
The image presents a comparative analysis of Retrieval-Augmented Generation (RAG) models against Non-RAG models across several key metrics: Transcription Quality, Relevance, Factuality, Completeness, Specificity, Ease of Understanding, Faithfulness, Hallucinations, and Outside Knowledge. The data is visualized using a combination of bar charts and pie charts to illustrate the performance differences between the two model types.
### Components/Axes
* **Transcription:**
* Metric: Transcription Quality
* Visualization: Pie chart
* Value: 4.48 (Green portion of the pie chart)
* **Retrieval:**
* Metric: Relevance
* Visualization: Pie chart
* Value: 4.34 (Green portion of the pie chart)
* **Generation:**
* Metrics: Factuality, Completeness, Specificity, Ease of Understanding, Faithfulness
* Visualization: Bar chart
* Y-axis: Numerical scale from 0.00 to 5.00, incrementing by 1.00
* X-axis: Categories - Factuality, Completeness, Specificity, Ease of Understanding, Faithfulness
* Legend:
* Red: Non-RAG
* Green: RAG
* **Hallucinations:**
* Visualization: Pie charts (one for Non-RAG, one for RAG)
* Categories: No, Not sure, Yes
* Legend:
* Green: No
* Yellow: Not sure
* Red: Yes
* **Outside Knowledge:**
* Visualization: Pie chart (RAG only)
* Categories: No, Not sure, Yes
* Legend:
* Green: No
* Yellow: Not sure
* Red: Yes
### Detailed Analysis
**1. Transcription Quality (Pie Chart):**
* Transcription Quality is represented by a pie chart with a single value of 4.48. This value likely represents a score or rating.
**2. Retrieval Relevance (Pie Chart):**
* Relevance is represented by a pie chart with a single value of 4.34. This value likely represents a score or rating.
**3. Generation (Bar Chart):**
* **Factuality:**
* Non-RAG (Red): Approximately 3.2
* RAG (Green): Approximately 4.0
* **Completeness:**
* Non-RAG (Red): Approximately 3.6
* RAG (Green): Approximately 4.1
* **Specificity:**
* Non-RAG (Red): Approximately 3.4
* RAG (Green): Approximately 4.5
* **Ease of Understanding:**
* Non-RAG (Red): Approximately 4.3
* RAG (Green): Approximately 4.2
* **Faithfulness:**
* Non-RAG (Red): Not present
* RAG (Green): Approximately 3.9
**4. Hallucinations (Pie Charts):**
* **Non-RAG:**
* Yes (Red): 30.0%
* Not sure (Yellow): 30.0%
* No (Green): 40.0%
* **RAG:**
* Yes (Red): 27.5%
* Not sure (Yellow): 25.0%
* No (Green): 47.5%
**5. Outside Knowledge (Pie Chart):**
* **RAG:**
* Yes (Red): 43.6%
* Not sure (Yellow): 38.5%
* No (Green): The remaining percentage, calculated as 100% - (43.6% + 38.5%) = 17.9%
### Key Observations
* RAG models generally outperform Non-RAG models in Factuality, Completeness, Specificity, and Faithfulness.
* The "Ease of Understanding" metric is slightly lower for RAG compared to Non-RAG.
* RAG models show a lower percentage of "Yes" responses for Hallucinations (27.5%) compared to Non-RAG models (30.0%), and a higher percentage of "No" responses (47.5% vs 40.0%).
* For Outside Knowledge in RAG models, "Yes" responses are at 43.6%, "Not sure" at 38.5%, and "No" at 17.9%.
### Interpretation
The data suggests that incorporating Retrieval-Augmented Generation (RAG) generally improves the performance of language models, particularly in areas like Factuality, Completeness, Specificity, and reducing Hallucinations. While "Ease of Understanding" is slightly lower for RAG, the overall benefits in other critical areas appear to outweigh this drawback. The "Outside Knowledge" pie chart for RAG models indicates that a significant portion of the generated content relies on external information, with a considerable percentage of responses being affirmative. The lower hallucination rate in RAG models suggests that retrieving and incorporating external knowledge helps ground the generated content in reality, reducing the likelihood of generating false or nonsensical information.