## Composite Dashboard: RAG vs Non-RAG Performance Analysis
### Overview
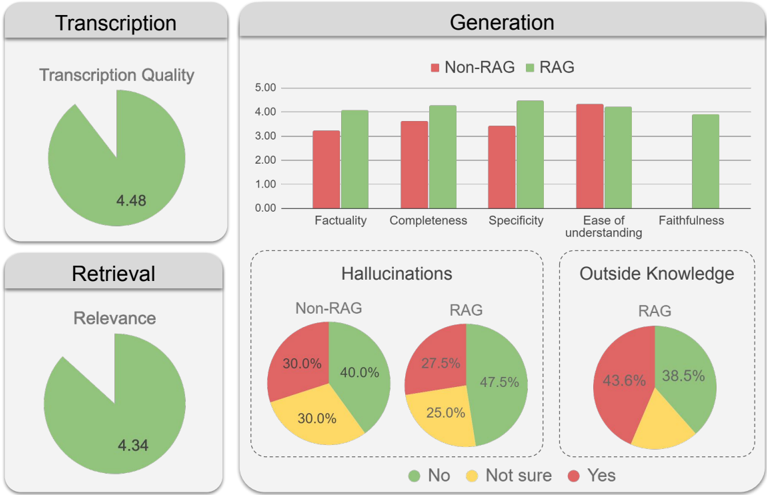
The image presents a comparative analysis of RAG (Retrieval-Augmented Generation) and Non-RAG systems across multiple performance dimensions. It combines pie charts, bar graphs, and segmented circular diagrams to visualize transcription quality, retrieval relevance, generation capabilities, hallucination rates, and external knowledge utilization.
### Components/Axes
1. **Transcription Section**
- Pie chart labeled "Transcription Quality"
- Single value: 4.48 (green segment)
- No explicit axis markers
2. **Retrieval Section**
- Pie chart labeled "Relevance"
- Single value: 4.34 (green segment)
- No explicit axis markers
3. **Generation Section**
- Bar chart comparing Non-RAG (red) and RAG (green)
- Categories: Factuality, Completeness, Specificity, Ease of understanding, Faithfulness
- Y-axis: 0.00 to 5.00 in 1.00 increments
- Legend: Red = Non-RAG, Green = RAG
4. **Hallucinations Section**
- Circular diagram with three segments:
- Green: No hallucinations
- Yellow: Not sure
- Red: Yes hallucinations
- Two versions: Non-RAG and RAG
5. **Outside Knowledge Section**
- Circular diagram with three segments:
- Green: No
- Yellow: Not sure
- Red: Yes
- Single version labeled "RAG"
### Detailed Analysis
**Transcription Quality**
- RAG system achieves 4.48/5.00 transcription quality
**Retrieval Relevance**
- RAG system achieves 4.34/5.00 relevance score
**Generation Performance**
| Category | Non-RAG | RAG |
|------------------------|---------|-------|
| Factuality | ~3.1 | ~4.0 |
| Completeness | ~3.6 | ~4.2 |
| Specificity | ~3.3 | ~4.3 |
| Ease of understanding | ~4.2 | ~4.1 |
| Faithfulness | - | ~3.9 |
**Hallucination Rates**
- Non-RAG:
- No: 40%
- Not sure: 30%
- Yes: 30%
- RAG:
- No: 47.5%
- Not sure: 25%
- Yes: 27.5%
**Outside Knowledge Utilization**
- RAG system:
- Yes: 43.6%
- Not sure: 18.5%
- No: 38.5%
### Key Observations
1. RAG consistently outperforms Non-RAG in transcription quality (4.48 vs 4.34) and generation metrics across all categories except Faithfulness
2. Hallucination rates decrease significantly with RAG (30% Yes → 27.5% Yes)
3. Outside knowledge utilization shows RAG systems demonstrate higher confidence (43.6% Yes vs 38.5% No)
4. Faithfulness metric only exists for RAG systems, suggesting it's a RAG-specific evaluation
5. Non-RAG systems show higher uncertainty in hallucination assessments (30% Not sure vs RAG's 25%)
### Interpretation
The data suggests RAG systems demonstrate superior performance across multiple dimensions:
- **Accuracy**: Higher transcription quality and generation scores indicate better factual accuracy
- **Reliability**: Lower hallucination rates (27.5% vs 30%) suggest more trustworthy outputs
- **Knowledge Integration**: Higher confidence in external knowledge utilization (43.6% Yes)
- **Completeness**: Better performance in generating comprehensive responses
Notably, the absence of Faithfulness metrics for Non-RAG systems implies this evaluation dimension may be inherently more challenging for traditional generation models without retrieval augmentation. The consistent green dominance in pie charts across sections visually reinforces RAG's superior performance profile.