Here is a detailed technical description of the image.
### **Overview**
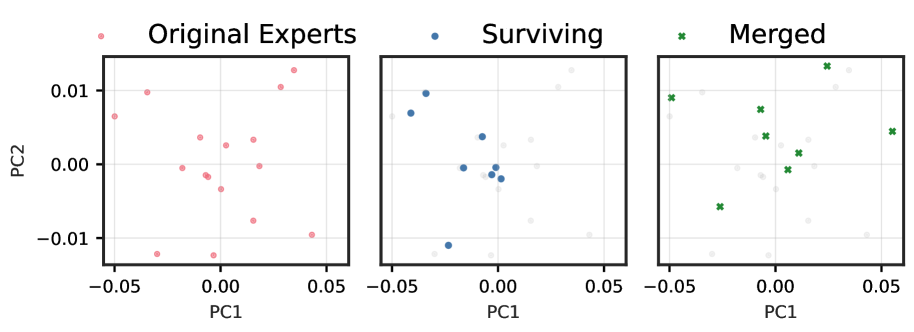
The image presents a series of three scatter plots arranged horizontally, sharing a common coordinate system. The plots illustrate the distribution of data points, likely representing "experts," in a two-dimensional principal component space defined by **PC1** (x-axis) and **PC2** (y-axis).
### **Common Plot Elements**
* **Y-axis (PC2):** The vertical axis is labeled "PC2". Major tick marks and grid lines are present at **-0.01**, **0.00**, and **0.01**. The axis range extends approximately from -0.015 to 0.015. This label is explicitly shown only on the leftmost plot but applies to all three.
* **X-axis (PC1):** The horizontal axis is labeled "PC1" for all three plots. Major tick marks and grid lines are present at **-0.05**, **0.00**, and **0.05**. The axis range extends approximately from -0.06 to 0.06.
* **Grid:** A light gray grid is overlaid on each plot, corresponding to the major tick marks on both axes.
---
### **Plot 1: Original Experts**
* **Title:** The plot is titled "**Original Experts**".
* **Legend/Marker:** A sample pink circle marker is displayed next to the title.
* **Data Representation:** The plot shows a distribution of **pink circle markers**.
* **Data Points (Approximate Coordinates [PC1, PC2]):**
* [-0.045, 0.006]
* [-0.035, 0.010]
* [-0.030, -0.012]
* [-0.018, -0.001]
* [-0.010, 0.003]
* [-0.008, -0.002]
* [-0.005, -0.002]
* [-0.003, -0.012]
* [0.000, -0.004]
* [0.005, 0.002]
* [0.015, -0.008]
* [0.018, 0.003]
* [0.020, -0.001]
* [0.030, 0.010]
* [0.035, 0.012]
* [0.045, -0.010]
---
### **Plot 2: Surviving**
* **Title:** The plot is titled "**Surviving**".
* **Legend/Marker:** A sample blue circle marker is displayed next to the title.
* **Data Representation:** The plot shows a subset of the original points as **blue circle markers**. Faint gray circle markers are also visible, representing the positions of all "Original Experts" from the first plot for context.
* **Data Points (Surviving - Blue Circles, Approximate Coordinates [PC1, PC2]):**
* [-0.040, 0.007]
* [-0.035, 0.010]
* [-0.025, -0.011]
* [-0.015, -0.001]
* [-0.008, 0.004]
* [-0.005, -0.002]
* [-0.002, -0.001]
* [0.000, -0.002]
---
### **Plot 3: Merged**
* **Title:** The plot is titled "**Merged**".
* **Legend/Marker:** A sample green 'x' marker is displayed next to the title.
* **Data Representation:** The plot shows a new set of points as **green 'x' markers**. Similar to the second plot, faint gray circle markers are visible in the background, showing the positions of the "Original Experts".
* **Data Points (Merged - Green 'x' Markers, Approximate Coordinates [PC1, PC2]):**
* [-0.048, 0.009]
* [-0.025, -0.006]
* [-0.005, 0.007]
* [-0.002, 0.004]
* [0.005, -0.001]
* [0.010, 0.001]
* [0.025, 0.013]
* [0.055, 0.004]