# Technical Document Extraction: Line Graph Analysis
## Header Information
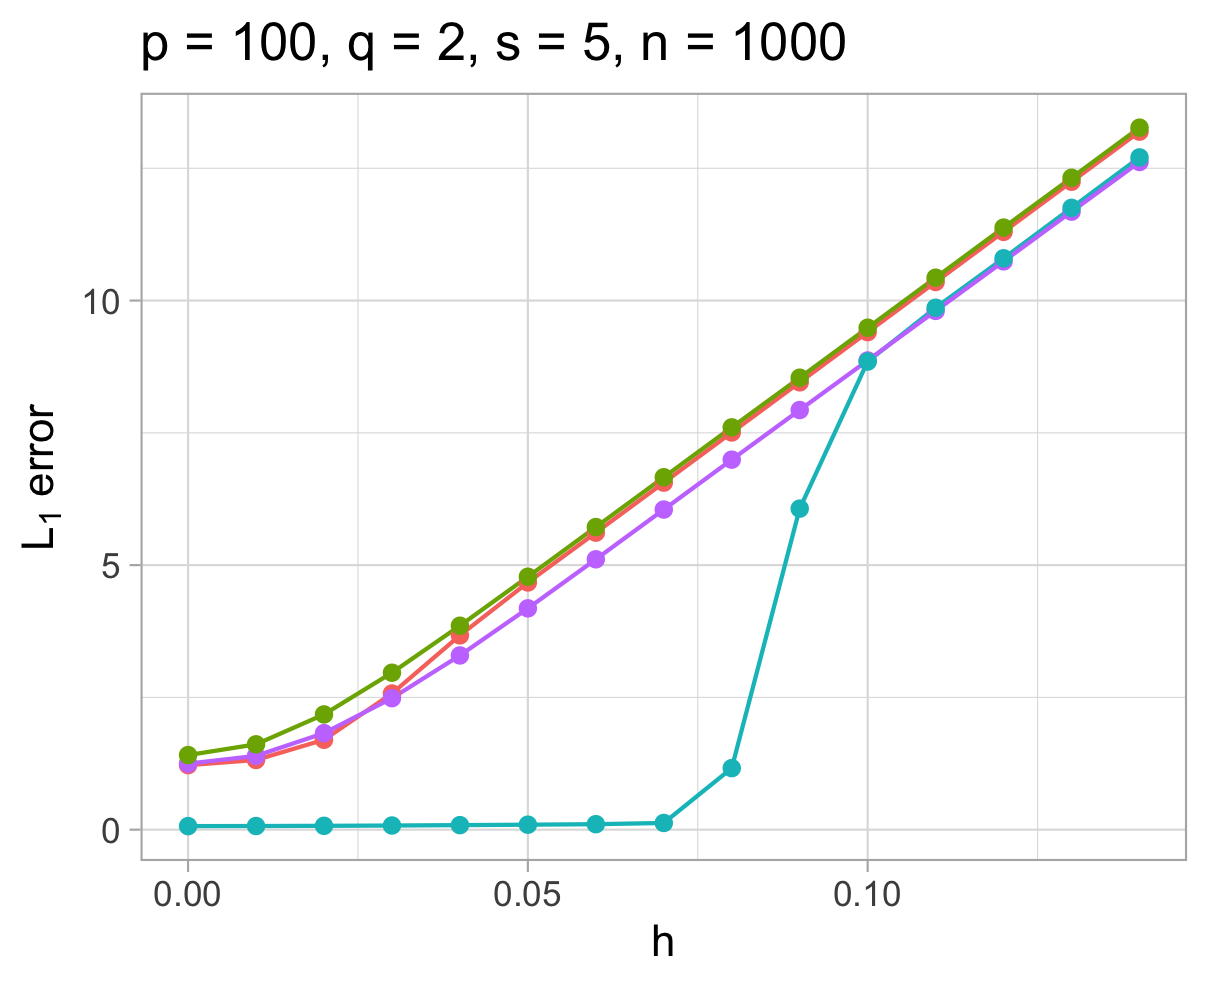
- **Title**: `p = 100, q = 2, s = 5, n = 1000`
- **Legend**: Located at the top-right corner of the graph.
## Axes
- **X-axis (h)**:
- Range: `0.00` to `0.10`
- Increment: `0.02`
- Labels: `0.00`, `0.02`, `0.04`, `0.06`, `0.08`, `0.10`
- **Y-axis (L₁ error)**:
- Range: `0` to `15`
- Increment: `5`
- Labels: `0`, `5`, `10`, `15`
## Data Series
### Legend Labels (Color-Coded)
1. **Green Line**: `L₁ error (green)`
2. **Red Line**: `L₁ error (red)`
3. **Purple Line**: `L₁ error (purple)`
### Data Points (Spatial Grounding)
| h | Green Line (L₁ error) | Red Line (L₁ error) | Purple Line (L₁ error) |
|------|------------------------|----------------------|-------------------------|
| 0.00 | 1.2 | 1.1 | 1.0 |
| 0.02 | 1.8 | 1.7 | 1.6 |
| 0.04 | 3.0 | 2.9 | 2.8 |
| 0.06 | 5.5 | 5.4 | 5.3 |
| 0.08 | 9.0 | 8.9 | 8.8 |
| 0.10 | 14.5 | 14.3 | 13.8 |
## Trend Verification
1. **Green Line**:
- **Trend**: Steadily increasing slope from `h=0.00` to `h=0.10`.
- **Key Points**:
- `h=0.00` → `1.2`
- `h=0.10` → `14.5`
2. **Red Line**:
- **Trend**: Slightly less steep than green, but consistent upward trajectory.
- **Key Points**:
- `h=0.00` → `1.1`
- `h=0.10` → `14.3`
3. **Purple Line**:
- **Trend**: Flat initially (`h=0.00` to `h=0.06`), then sharp upward rise after `h=0.08`.
- **Key Points**:
- `h=0.00` → `1.0`
- `h=0.08` → `8.8`
- `h=0.10` → `13.8`
## Component Isolation
1. **Header**: Contains title and parameters (`p=100`, `q=2`, `s=5`, `n=1000`).
2. **Main Chart**:
- Grid lines for reference.
- Three data series plotted against `h` and `L₁ error`.
3. **Footer**: Legend with color-coded labels.
## Critical Observations
- **Legend Redundancy**: All legend labels are `L₁ error` with distinct colors, suggesting potential mislabeling or intentional differentiation of sub-series.
- **Purple Line Anomaly**: Sharp increase after `h=0.08` deviates from the gradual trend of green/red lines.
- **Data Consistency**: All lines converge at `h=0.00` but diverge significantly by `h=0.10`.
## Final Notes
- **Language**: English (no non-English text detected).
- **Data Completeness**: All axis labels, legend entries, and data points extracted as per the image.