# Technical Document Analysis: GPT-4 vs GPT-3.5-Turbo Evaluation Chart
## Chart Type
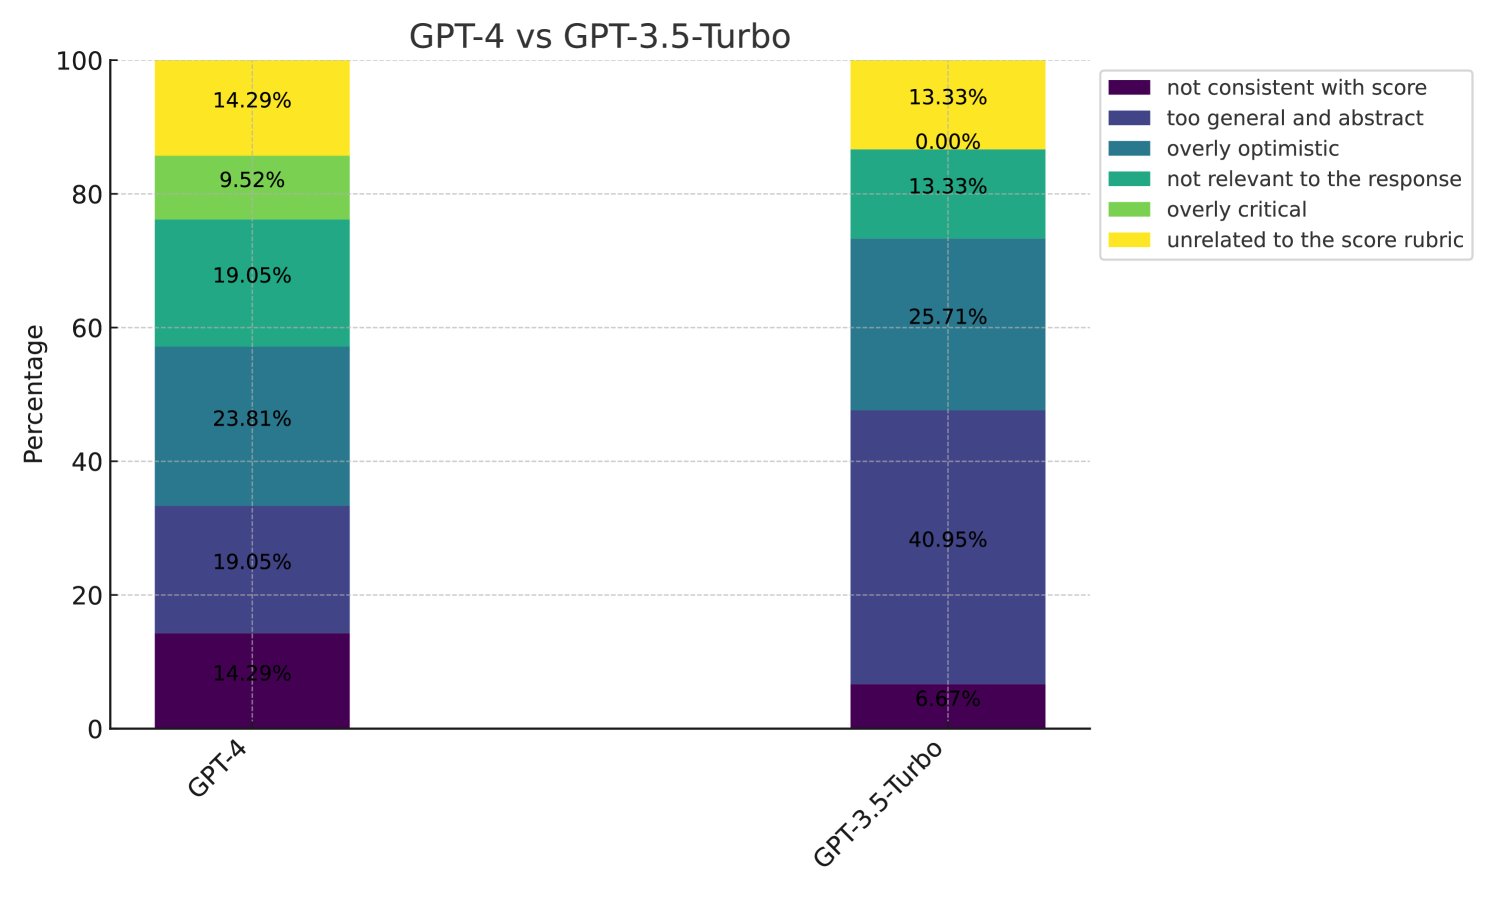
Stacked bar chart comparing performance metrics of two AI models across evaluation categories.
## Axes
- **X-axis**: Model names ("GPT-4", "GPT-3.5-Turbo")
- **Y-axis**: Percentage scale (0–100) labeled "Percentage"
## Legend
Positioned on the right side of the chart. Color-coded categories:
1. **Purple**: "not consistent with score"
2. **Dark Blue**: "too general and abstract"
3. **Teal**: "overly optimistic"
4. **Green**: "not relevant to the response"
5. **Light Green**: "overly critical"
6. **Yellow**: "unrelated to the score rubric"
## Data Points
### GPT-4
- **Purple** ("not consistent with score"): 14.29%
- **Dark Blue** ("too general and abstract"): 19.05%
- **Teal** ("overly optimistic"): 23.81%
- **Green** ("not relevant to the response"): 19.05%
- **Light Green** ("overly critical"): 9.52%
- **Yellow** ("unrelated to the score rubric"): 14.29%
### GPT-3.5-Turbo
- **Purple** ("not consistent with score"): 6.67%
- **Dark Blue** ("too general and abstract"): 40.95%
- **Teal** ("overly optimistic"): 25.71%
- **Green** ("not relevant to the response"): 13.33%
- **Light Green** ("overly critical"): 0.00%
- **Yellow** ("unrelated to the score rubric"): 13.33%
## Key Observations
1. **GPT-4** shows a more balanced distribution across categories, with the largest segment being "overly optimistic" (23.81%).
2. **GPT-3.5-Turbo** has a significantly higher proportion of responses categorized as "too general and abstract" (40.95%), the largest segment.
3. Both models have identical "unrelated to the score rubric" percentages (14.29% for GPT-4, 13.33% for GPT-3.5-Turbo).
4. GPT-3.5-Turbo has no responses in the "overly critical" category (0.00%).
## Spatial Grounding
- Legend: Right-aligned, adjacent to the bars.
- Data segments: Horizontally stacked within each bar, ordered by legend sequence.
## Trend Verification
- **GPT-4**: Segments decrease in size from "overly optimistic" (23.81%) to "overly critical" (9.52%).
- **GPT-3.5-Turbo**: Segments increase from "not consistent with score" (6.67%) to "too general and abstract" (40.95%), then decrease to "unrelated" (13.33%).
## Component Isolation
- **Header**: Chart title "GPT-4 vs GPT-3.5-Turbo"
- **Main Chart**: Stacked bars with percentage values
- **Footer**: Legend with color-coded categories
## Data Table Reconstruction
| Category | GPT-4 (%) | GPT-3.5-Turbo (%) |
|------------------------------|-----------|-------------------|
| Not consistent with score | 14.29 | 6.67 |
| Too general and abstract | 19.05 | 40.95 |
| Overly optimistic | 23.81 | 25.71 |
| Not relevant to the response | 19.05 | 13.33 |
| Overly critical | 9.52 | 0.00 |
| Unrelated to the score rubric| 14.29 | 13.33 |
## Color Consistency Check
- All legend colors match the corresponding bar segments.
- Example: Purple segments (14.29% for GPT-4, 6.67% for GPT-3.5-Turbo) align with "not consistent with score" label.