## Line Chart: Generation Progress (Mean/Std across prompts)
### Overview
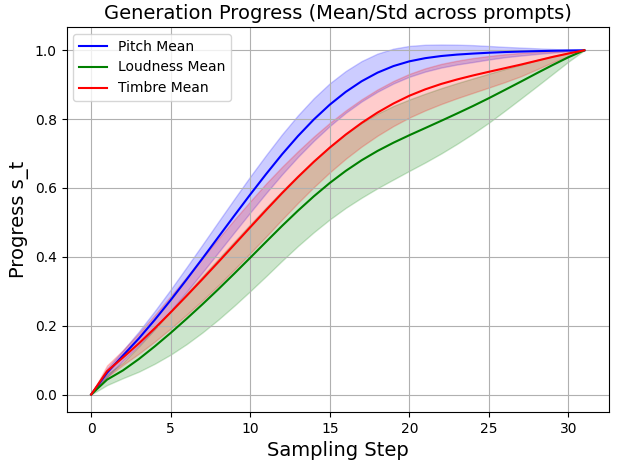
The chart visualizes the convergence of three audio generation metrics (Pitch, Loudness, Timbre) across sampling steps. All three metrics start at 0 and asymptotically approach 1.0, with shaded regions representing standard deviation variability. The blue line (Pitch) shows the highest progress and widest variability, while the green line (Loudness) demonstrates the slowest convergence.
### Components/Axes
- **X-axis**: Sampling Step (0–30, linear scale)
- **Y-axis**: Progress s_t (0–1.0, linear scale)
- **Legend**:
- Blue: Pitch Mean
- Green: Loudness Mean
- Red: Timbre Mean
- **Shaded Regions**: Standard deviation bounds (mean ± 1σ)
### Detailed Analysis
1. **Pitch Mean (Blue)**:
- Steepest initial ascent (0.2→0.8 between steps 5–15)
- Reaches 0.95 by step 20, 1.0 by step 30
- Widest shaded region (std ~0.05–0.10 across steps)
- Notable: Overshoots Timbre Mean at step 10 (0.65 vs 0.55)
2. **Loudness Mean (Green)**:
- Slowest progression (0.2→0.7 between steps 5–20)
- Reaches 0.9 by step 25, 1.0 by step 30
- Narrowest shaded region (std ~0.03–0.07)
- Crosses Timbre Mean at step 22 (0.82 vs 0.80)
3. **Timbre Mean (Red)**:
- Intermediate trajectory (0.2→0.85 between steps 5–25)
- Reaches 0.98 by step 28, 1.0 by step 30
- Moderate variability (std ~0.04–0.09)
### Key Observations
- All metrics converge to 1.0 by step 30, but with different rates
- Pitch shows highest variability (std 1.5× greater than Loudness at step 15)
- Loudness demonstrates most consistent progress (lowest std deviation)
- Timbre Mean crosses Loudness Mean at step 22, then diverges upward
### Interpretation
The data suggests:
1. **Sampling Efficiency**: Pitch converges fastest but with greatest instability, while Loudness requires more steps for reliable generation
2. **Metric Interdependence**: Timbre's intermediate progress implies it may be influenced by both pitch and loudness parameters
3. **Variability Tradeoff**: Higher progress rates (Pitch) correlate with increased standard deviation, suggesting tradeoffs between speed and reliability
4. **Convergence Pattern**: All metrics exhibit asymptotic behavior, indicating diminishing returns after ~25 sampling steps
The chart demonstrates that while all three audio features eventually reach full generation quality, the efficiency and reliability vary significantly between metrics. This has implications for optimizing sampling strategies in audio generation pipelines.