## Chart: Validation Score vs. Training Step for AIME25 Benchmark
### Overview
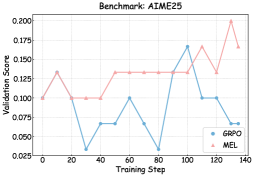
The image is a line chart comparing the validation scores of two models, GRPO and MEL, over training steps for the AIME25 benchmark. The chart displays the validation score on the y-axis and the training step on the x-axis.
### Components/Axes
* **Title:** Benchmark: AIME25
* **X-axis:** Training Step, with markers at 0, 20, 40, 60, 80, 100, 120, and 140.
* **Y-axis:** Validation Score, with markers at 0.025, 0.050, 0.075, 0.100, 0.125, 0.150, 0.175, and 0.200.
* **Legend:** Located in the bottom-right corner.
* GRPO (Blue)
* MEL (Pink)
### Detailed Analysis
* **GRPO (Blue):**
* Starts at approximately 0.100 at training step 0.
* Decreases to approximately 0.033 at training step 20.
* Relatively stable around 0.067 between training steps 40 and 60.
* Decreases to approximately 0.025 at training step 80.
* Increases sharply to approximately 0.167 at training step 100.
* Decreases to approximately 0.100 at training step 120.
* Remains at approximately 0.100 at training step 140.
* **MEL (Pink):**
* Starts at approximately 0.100 at training step 0.
* Increases to approximately 0.133 at training step 20.
* Decreases to approximately 0.100 at training step 40.
* Relatively stable around 0.133 between training steps 60 and 100.
* Decreases to approximately 0.167 at training step 120.
* Decreases to approximately 0.133 at training step 120.
* Increases sharply to approximately 0.200 at training step 140.
* Decreases to approximately 0.167 at training step 140.
### Key Observations
* The GRPO model shows more volatility in its validation score compared to the MEL model.
* The MEL model generally maintains a higher validation score than the GRPO model, especially in the later training steps.
* Both models show fluctuations in their validation scores, indicating potential overfitting or the need for further optimization.
### Interpretation
The chart compares the performance of two models, GRPO and MEL, on the AIME25 benchmark. The validation scores indicate how well each model generalizes to unseen data during training. The MEL model appears to perform better overall, achieving higher validation scores and demonstrating more stability. The GRPO model, while showing some improvement during training, exhibits more significant fluctuations, suggesting it may be more sensitive to the training data or require different hyperparameter tuning. The sharp increase in MEL's validation score near the end of training suggests it may be converging towards a better solution, while GRPO's performance plateaus. These observations can inform decisions about model selection, hyperparameter tuning, and further experimentation to improve the performance of both models.