\n
## Line Chart: Validation Score vs. Training Step (Benchmark: AIME25)
### Overview
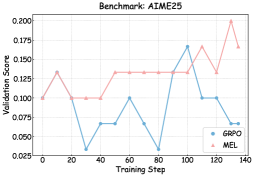
The image presents a line chart comparing the validation scores of two models, "GRPO" and "MEL", across different training steps. The chart aims to visualize the performance of each model during the training process on the AIME25 benchmark.
### Components/Axes
* **Title:** Benchmark: AIME25 (positioned at the top-center)
* **X-axis:** Training Step (ranging from approximately 0 to 140, with tick marks at intervals of 20)
* **Y-axis:** Validation Score (ranging from approximately 0.02 to 0.20, with tick marks at intervals of 0.05)
* **Legend:** Located in the bottom-right corner.
* GRPO (represented by a blue line with circular markers)
* MEL (represented by a pink line with triangular markers)
* **Gridlines:** Present to aid in reading values.
### Detailed Analysis
**GRPO (Blue Line):**
The GRPO line exhibits a fluctuating trend. It starts at approximately 0.10, dips to a minimum of around 0.025 at a training step of 20, then rises to a peak of approximately 0.175 at a training step of 100. After this peak, it declines to around 0.10 at a training step of 120, and finally drops to approximately 0.06 at a training step of 140.
* (0, 0.10)
* (20, 0.025)
* (40, 0.065)
* (60, 0.10)
* (80, 0.025)
* (100, 0.175)
* (120, 0.10)
* (140, 0.06)
**MEL (Pink Line):**
The MEL line shows a generally increasing trend with some fluctuations. It begins at approximately 0.10, rises to a peak of around 0.13 at a training step of 20, then plateaus around 0.10 until a training step of 60. From 60 to 100, it increases to approximately 0.14, and then rises sharply to a maximum of approximately 0.20 at a training step of 140.
* (0, 0.10)
* (20, 0.13)
* (40, 0.10)
* (60, 0.10)
* (80, 0.13)
* (100, 0.14)
* (120, 0.15)
* (140, 0.20)
### Key Observations
* The GRPO model demonstrates significant fluctuations in validation score throughout the training process, indicating potential instability or sensitivity to training data.
* The MEL model exhibits a more stable and generally increasing trend, suggesting more consistent learning.
* The MEL model consistently outperforms the GRPO model after a training step of 80.
* Both models start with similar validation scores.
### Interpretation
The chart suggests that the MEL model is more effective at learning from the AIME25 benchmark data compared to the GRPO model. The consistent upward trend of the MEL model indicates that it is successfully generalizing to the validation data as training progresses. The GRPO model's erratic behavior suggests it may be overfitting to the training data or encountering difficulties in convergence. The difference in performance between the two models becomes more pronounced as training continues, highlighting the superior learning capabilities of the MEL model in this specific scenario. The initial similar performance suggests both models start with comparable initial conditions, but their learning dynamics diverge over time. The AIME25 benchmark appears to favor the learning strategy employed by the MEL model.