## 2D Parametric Plot: Butterfly Trajectory
### Overview
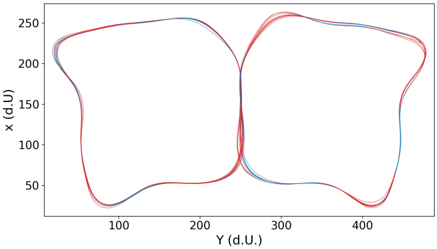
The image displays a 2D parametric plot resembling a butterfly or a figure-eight shape. The plot consists of multiple overlapping, continuous lines in varying shades of red and blue. The lines form two distinct, symmetric lobes that meet at a central point. The axes are labeled "x (d.U.)" for the vertical axis and "Y (d.U.)" for the horizontal axis.
### Components/Axes
* **Vertical Axis (labeled "x (d.U.)"):**
* Scale: Ranges from 50 to 250.
* Ticks: 50, 100, 150, 200, 250.
* **Horizontal Axis (labeled "Y (d.U.)"):**
* Scale: Ranges from 100 to 400 (with visual data extending beyond these bounds).
* Ticks: 100, 200, 300, 400.
* **Data Series:**
* Multiple overlapping traces (lines).
* Colors: Red and Blue.
* There is **no legend** provided in the image to define the distinction between the red and blue lines.
### Detailed Analysis
* **Spatial Grounding:**
* The plot is centered horizontally around Y ≈ 250.
* The vertical extent of the shape ranges from approximately x ≈ 25 to x ≈ 260.
* The horizontal extent of the shape ranges from approximately Y ≈ 30 to Y ≈ 480.
* **Trend Verification:**
* The lines originate/converge at a central point near (Y=250, x=150).
* From the center, the lines diverge into two symmetric lobes:
* **Left Lobe:** Curves upward to a peak at x ≈ 255, then sweeps outward and down to a local minimum at Y ≈ 80, x ≈ 25, before curving back toward the center.
* **Right Lobe:** Mirrors the left, curving upward to a peak at x ≈ 255, sweeping outward and down to a local minimum at Y ≈ 420, x ≈ 25, before returning to the center.
* The lines are tightly clustered, indicating high repeatability or multiple iterations of the same underlying function with minimal variance.
### Key Observations
* **Symmetry:** The plot exhibits near-perfect bilateral symmetry across the vertical axis Y=250.
* **Axis Labeling Anomaly:** The axes are labeled non-conventionally. The vertical axis is labeled "x" and the horizontal axis is labeled "Y". This suggests the plot may represent a phase-space diagram or a relationship between two variables where the vertical variable is named "x" and the horizontal is "Y".
* **Clustering:** The "thickness" of the lines is actually a bundle of multiple traces. The red and blue lines appear to follow the same general path, suggesting that the different colors represent different conditions (e.g., different time steps, different initial parameters, or different trials) that converge on the same attractor.
* **"d.U." Notation:** The unit "d.U." likely stands for "data units" or "dimensionless units," indicating that the plot is likely derived from a simulation or a mathematical model rather than physical measurements with standard SI units.
### Interpretation
The data suggests a stable, deterministic system, likely a dynamical system or a control loop, visualized in phase space. The butterfly shape is characteristic of attractors found in non-linear dynamics (similar to a Lorenz attractor projection).
The fact that the red and blue lines overlap so closely suggests that the system is robust; regardless of the variation represented by the color difference, the system returns to the same geometric "attractor." The central convergence point (Y=250, x=150) acts as a critical node or equilibrium point through which the trajectory passes repeatedly. The "d.U." labeling confirms this is an abstract or simulated dataset.