## Bar Chart: Absolute Performance by Hops
### Overview
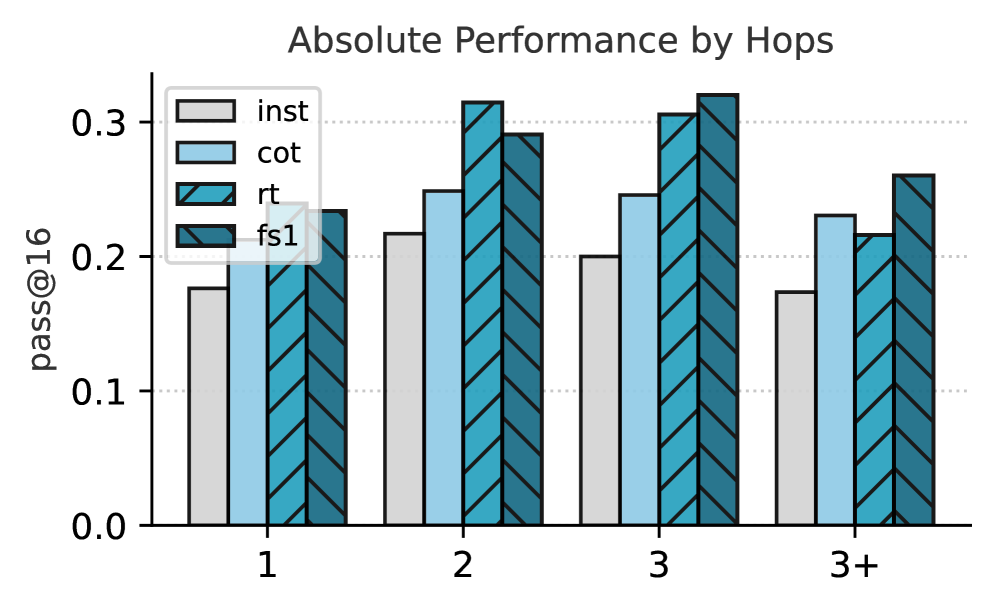
The image is a bar chart comparing the absolute performance of four different methods ("inst", "cot", "rt", and "fs1") across varying numbers of hops (1, 2, 3, and 3+). The y-axis represents "pass@16", a performance metric, ranging from 0.0 to 0.3.
### Components/Axes
* **Title:** Absolute Performance by Hops
* **Y-axis:** pass@16, ranging from 0.0 to 0.3 in increments of 0.1.
* **X-axis:** Hops, with categories 1, 2, 3, and 3+.
* **Legend:** Located in the top-left corner.
* inst: Light gray bar
* cot: Light blue bar
* rt: Teal bar with diagonal stripes
* fs1: Dark teal bar with diagonal stripes
### Detailed Analysis
Here's a breakdown of the performance for each method across different hop counts:
* **inst (Light Gray):**
* Hop 1: Approximately 0.18
* Hop 2: Approximately 0.22
* Hop 3: Approximately 0.20
* Hop 3+: Approximately 0.18
* Trend: Increases from hop 1 to hop 2, then decreases slightly at hop 3, and returns to the original value at hop 3+.
* **cot (Light Blue):**
* Hop 1: Approximately 0.20
* Hop 2: Approximately 0.26
* Hop 3: Approximately 0.24
* Hop 3+: Approximately 0.22
* Trend: Increases from hop 1 to hop 2, then decreases at hop 3 and hop 3+.
* **rt (Teal with Stripes):**
* Hop 1: Approximately 0.23
* Hop 2: Approximately 0.31
* Hop 3: Approximately 0.30
* Hop 3+: Approximately 0.25
* Trend: Increases from hop 1 to hop 2, remains high at hop 3, then decreases at hop 3+.
* **fs1 (Dark Teal with Stripes):**
* Hop 1: Approximately 0.24
* Hop 2: Approximately 0.29
* Hop 3: Approximately 0.32
* Hop 3+: Approximately 0.26
* Trend: Increases from hop 1 to hop 3, then decreases at hop 3+.
### Key Observations
* "fs1" generally shows the highest performance across all hop counts, peaking at hop 3.
* "inst" consistently shows the lowest performance across all hop counts.
* All methods show a performance increase from hop 1 to hop 2.
* Performance tends to decrease slightly at hop 3+ compared to hop 2 or 3 for all methods.
### Interpretation
The chart illustrates the performance of different methods in relation to the number of hops. The "fs1" method appears to be the most effective overall, while "inst" is the least. The performance of all methods seems to be affected by the number of hops, with a general trend of increasing performance up to a certain number of hops (2 or 3), followed by a slight decrease at "3+". This suggests that there might be an optimal number of hops for these methods, beyond which performance starts to diminish. The "pass@16" metric likely represents a measure of accuracy or success rate, and the chart provides a comparative analysis of how different approaches fare under varying conditions.