\n
## Bar Chart: Absolute Performance by Hops
### Overview
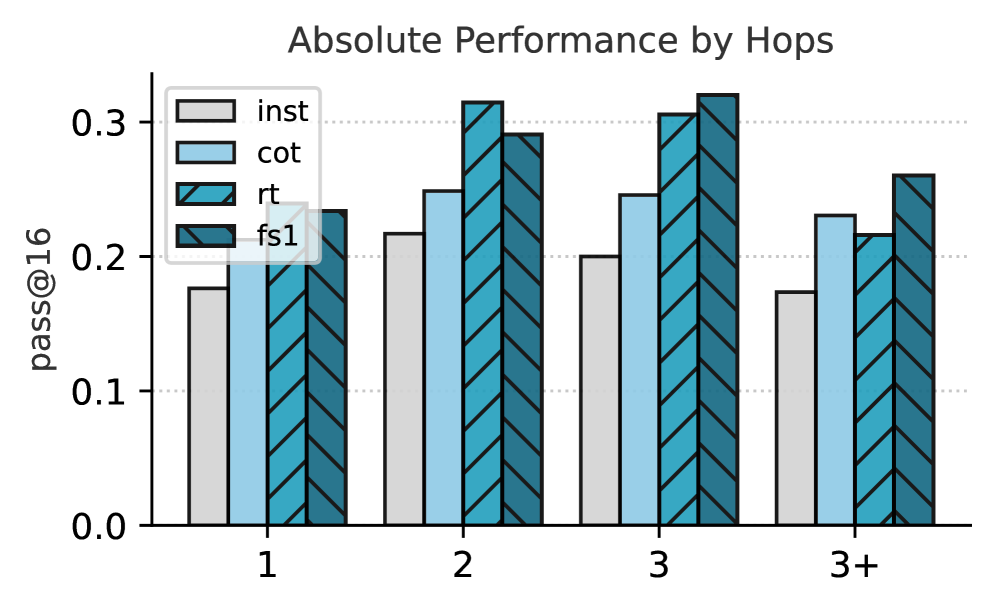
The image presents a bar chart comparing the performance of four different methods ("inst", "cot", "rt", "fs1") across varying numbers of hops (1, 2, 3, and 3+). The performance metric is "pass@16", which appears to represent a success rate. Each hop count has four bars, one for each method, showing the corresponding pass@16 value.
### Components/Axes
* **Title:** "Absolute Performance by Hops" - positioned at the top-center of the chart.
* **X-axis:** "Hops" - labeled at the bottom of the chart, with markers at 1, 2, 3, and 3+.
* **Y-axis:** "pass@16" - labeled on the left side of the chart, ranging from 0.0 to 0.35, with increments of 0.05.
* **Legend:** Located in the top-left corner of the chart. It defines the color-coding for each method:
* "inst" - Light Gray
* "cot" - Light Blue
* "rt" - Dark Gray
* "fs1" - Teal/Cyan
### Detailed Analysis
The chart consists of four groups of bars, one for each hop count. Within each group, there are four bars representing the "pass@16" values for each method.
* **1 Hop:**
* inst: Approximately 0.17
* cot: Approximately 0.21
* rt: Approximately 0.23
* fs1: Approximately 0.22
* **2 Hops:**
* inst: Approximately 0.21
* cot: Approximately 0.26
* rt: Approximately 0.32
* fs1: Approximately 0.34
* **3 Hops:**
* inst: Approximately 0.23
* cot: Approximately 0.25
* rt: Approximately 0.30
* fs1: Approximately 0.35
* **3+ Hops:**
* inst: Approximately 0.23
* cot: Approximately 0.24
* rt: Approximately 0.27
* fs1: Approximately 0.25
**Trends:**
* Generally, performance (pass@16) increases as the number of hops increases, up to 3 hops.
* "fs1" consistently shows the highest performance, especially at 3 hops.
* "inst" consistently shows the lowest performance.
* "rt" and "cot" show similar performance, with "rt" slightly outperforming "cot" at higher hop counts.
### Key Observations
* The largest performance gains are observed when increasing from 2 to 3 hops, particularly for "fs1" and "rt".
* The performance difference between methods is relatively small at 1 hop, but becomes more pronounced at higher hop counts.
* The performance of "inst" remains relatively stable across all hop counts.
### Interpretation
The chart demonstrates the impact of the number of hops on the performance of different methods. The increasing performance with more hops suggests that the methods benefit from additional processing steps or information gathering. The consistent superiority of "fs1" indicates that this method is particularly effective in leveraging multiple hops. The relatively stable performance of "inst" suggests that it may be limited by its inherent design or approach. The data suggests that for optimal performance, utilizing 3 hops is beneficial, and the "fs1" method is the most effective choice. The "3+" hop category shows a slight decrease in performance for "fs1" compared to 3 hops, which could indicate diminishing returns or potential issues with excessive hops. This could be a point for further investigation.