## Bar Chart: Normalized Execution Time vs. Context Length
### Overview
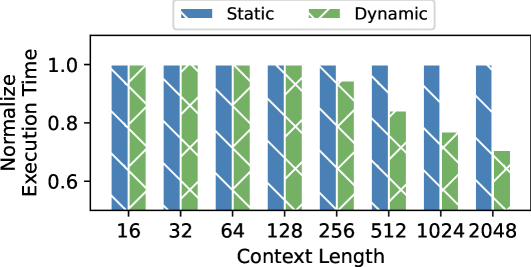
The image is a bar chart comparing the normalized execution time of "Static" and "Dynamic" processes across different context lengths. The x-axis represents the context length, ranging from 16 to 2048. The y-axis represents the normalized execution time, ranging from 0.6 to 1.0.
### Components/Axes
* **Title:** There is no explicit title on the chart.
* **X-axis:**
* **Label:** Context Length
* **Scale:** 16, 32, 64, 128, 256, 512, 1024, 2048
* **Y-axis:**
* **Label:** Normalize Execution Time
* **Scale:** 0.6, 0.8, 1.0
* **Legend:** Located at the top of the chart.
* **Blue:** Static
* **Green:** Dynamic
### Detailed Analysis
The chart displays two sets of bars for each context length, representing "Static" (blue) and "Dynamic" (green) execution times. Both bars are filled with a white diagonal crosshatch pattern.
* **Static (Blue):** The "Static" execution time remains consistently at approximately 1.0 for all context lengths from 16 to 2048.
* **Dynamic (Green):** The "Dynamic" execution time starts near 1.0 for context lengths 16 to 128, then decreases as the context length increases.
* Context Length 16: ~1.0
* Context Length 32: ~1.0
* Context Length 64: ~1.0
* Context Length 128: ~1.0
* Context Length 256: ~0.95
* Context Length 512: ~0.82
* Context Length 1024: ~0.77
* Context Length 2048: ~0.70
### Key Observations
* The "Static" execution time is consistently high and unaffected by the context length.
* The "Dynamic" execution time decreases as the context length increases, suggesting that the "Dynamic" process becomes more efficient with longer context lengths.
* There is a significant difference in execution time between "Static" and "Dynamic" processes at higher context lengths (1024 and 2048).
### Interpretation
The data suggests that the "Dynamic" process benefits from longer context lengths, resulting in reduced execution time. The "Static" process, however, does not show any improvement with increased context length, maintaining a consistently high execution time. This could indicate that the "Dynamic" process is better optimized for handling larger contexts, while the "Static" process may have a fixed overhead regardless of the context size. The chart highlights the performance trade-offs between "Static" and "Dynamic" approaches, particularly in scenarios with varying context lengths.