## Histogram Grid: Compilation and Verification Time Distributions
### Overview
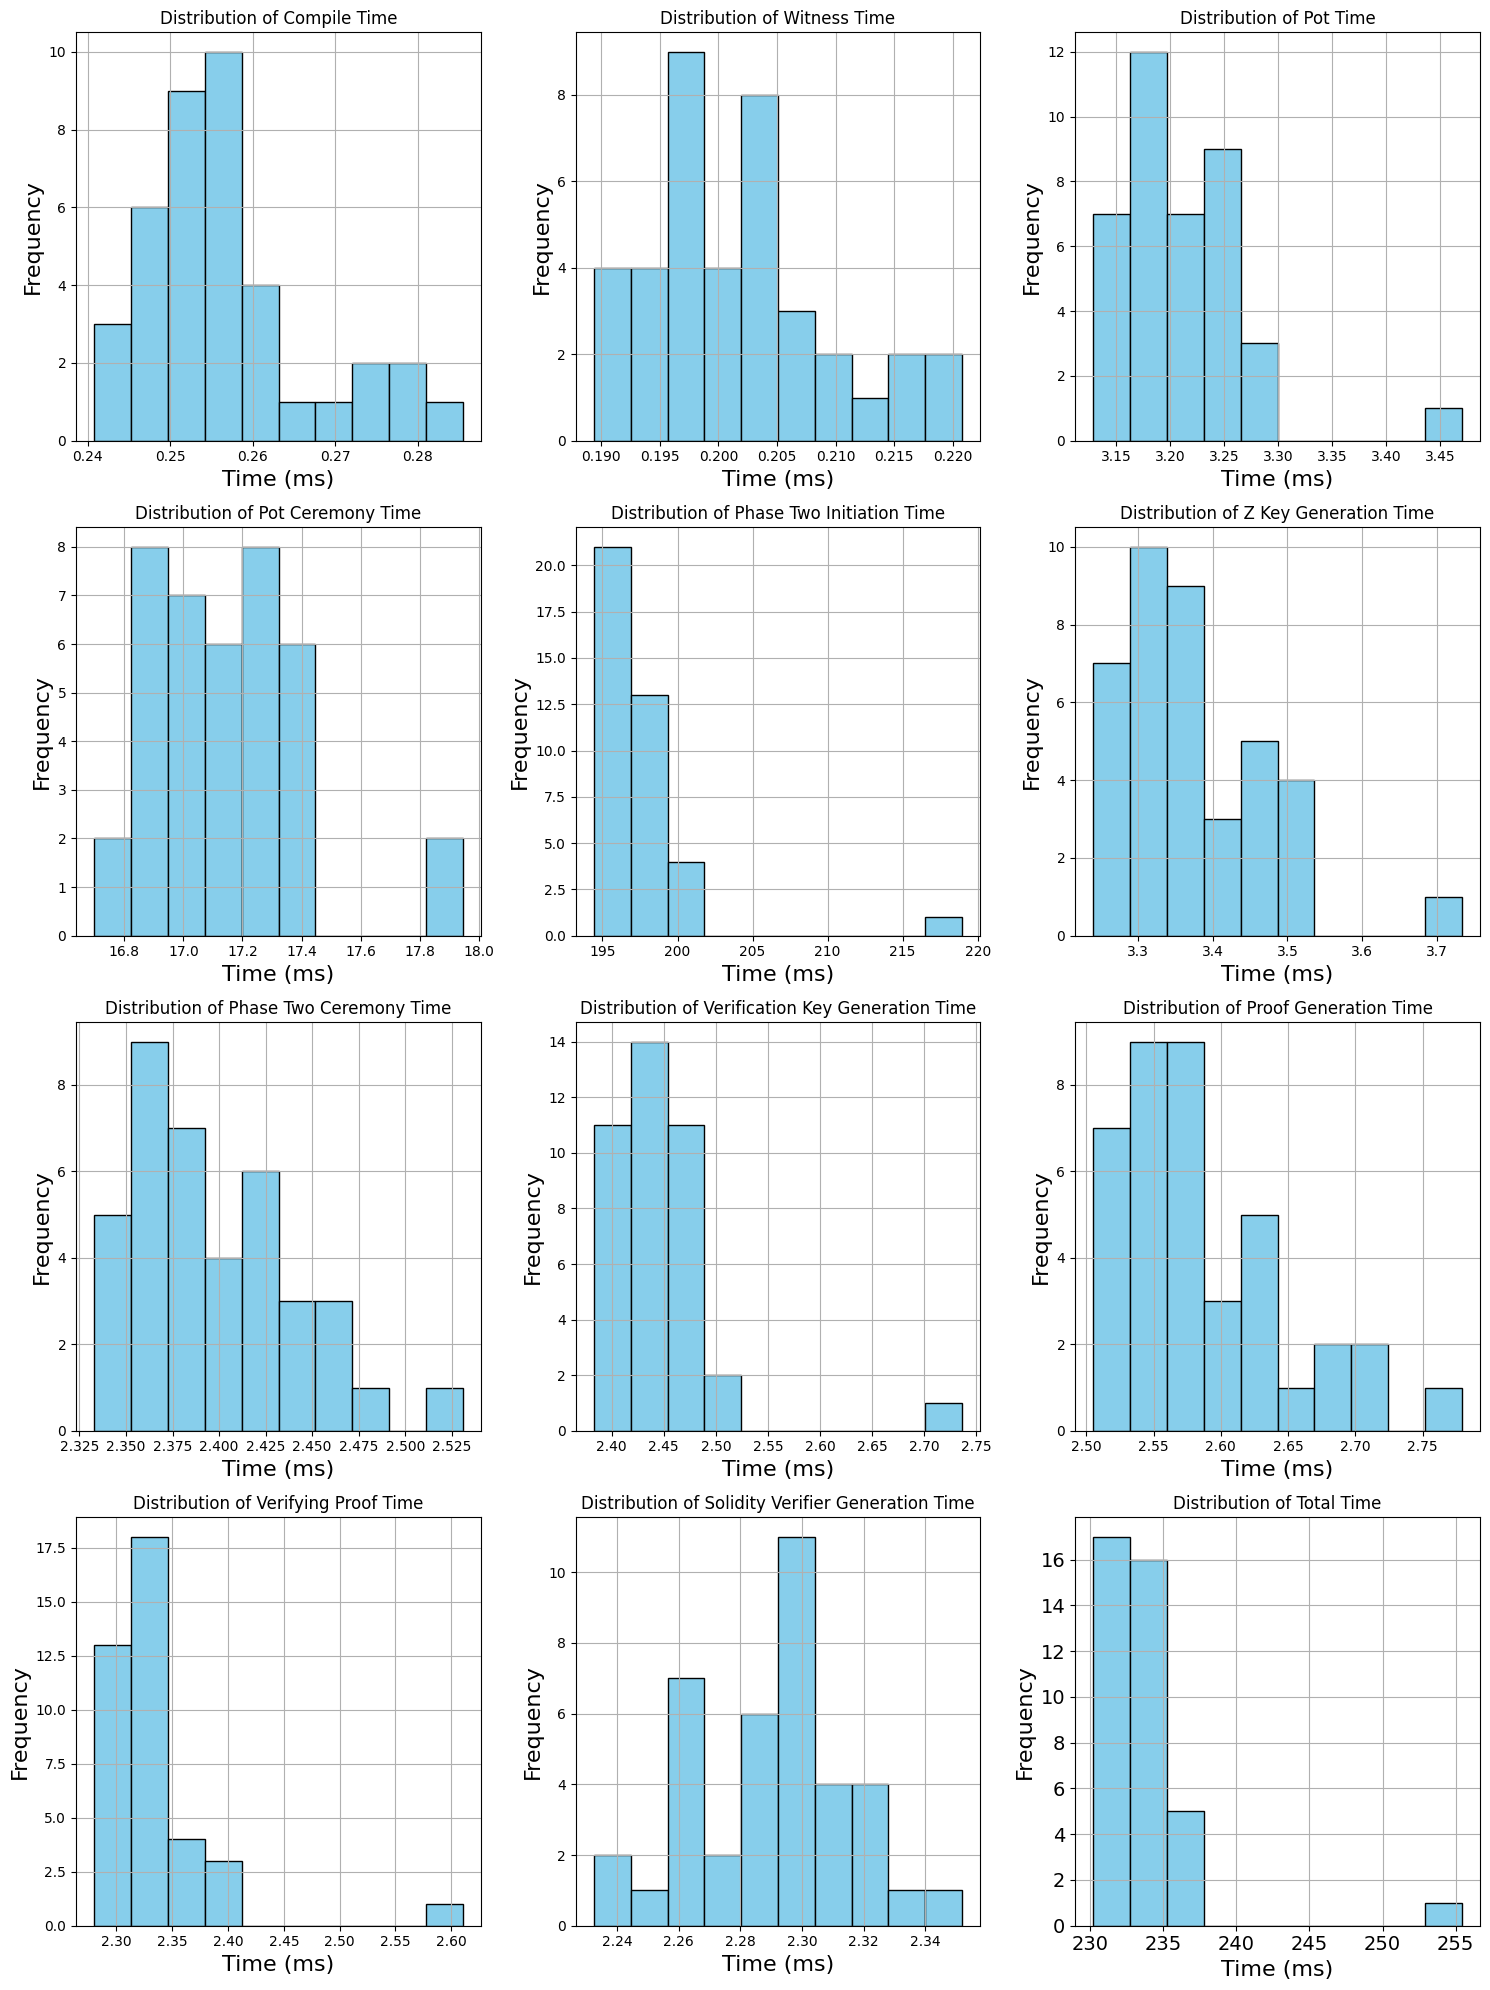
The image presents a grid of 12 histograms, each displaying the distribution of time (in milliseconds) for different stages in a cryptographic process. The stages include compilation, witness generation, proof generation, and other related operations. All histograms share a consistent visual style, using light blue bars with black outlines and gridlines in the background. The y-axis represents frequency, and the x-axis represents time in milliseconds.
### Components/Axes
Each histogram has the following components:
* **Title:** Indicates the specific stage of the process being measured (e.g., "Distribution of Compile Time").
* **X-axis:** Labeled "Time (ms)" with varying scales depending on the time range for each stage.
* **Y-axis:** Labeled "Frequency," indicating the number of occurrences within each time interval.
* **Bars:** Light blue bars representing the frequency of times within specific ranges.
* **Gridlines:** Light gray gridlines behind the bars to aid in reading values.
### Detailed Analysis
Here's a breakdown of each histogram, including approximate values:
1. **Distribution of Compile Time:**
* X-axis: 0.24 to 0.28 ms
* Peak frequency: Around 9-10, between 0.25 and 0.26 ms.
* Frequencies:
* 0.24-0.25 ms: ~3
* 0.25-0.26 ms: ~9-10
* 0.26-0.27 ms: ~4
* 0.27-0.28 ms: ~2
2. **Distribution of Witness Time:**
* X-axis: 0.190 to 0.220 ms
* Peak frequency: Around 8-9, between 0.195 and 0.200 ms.
* Frequencies:
* 0.190-0.195 ms: ~4
* 0.195-0.200 ms: ~8-9
* 0.200-0.205 ms: ~5
* 0.205-0.210 ms: ~2
* 0.210-0.215 ms: ~2
* 0.215-0.220 ms: ~2
3. **Distribution of Pot Time:**
* X-axis: 3.15 to 3.45 ms
* Peak frequency: Around 12, between 3.15 and 3.20 ms.
* Frequencies:
* 3.15-3.20 ms: ~12
* 3.20-3.25 ms: ~7
* 3.25-3.30 ms: ~3
* 3.45-3.50 ms: ~1
4. **Distribution of Pot Ceremony Time:**
* X-axis: 16.8 to 18.0 ms
* Peak frequency: Around 7-8, between 17.2 and 17.4 ms.
* Frequencies:
* 16.8-17.0 ms: ~2
* 17.0-17.2 ms: ~7
* 17.2-17.4 ms: ~7-8
* 17.4-17.6 ms: ~6
* 17.8-18.0 ms: ~2
5. **Distribution of Phase Two Initiation Time:**
* X-axis: 195 to 220 ms
* Peak frequency: Around 18-19, between 195 and 200 ms.
* Frequencies:
* 195-200 ms: ~18-19
* 200-205 ms: ~13
* 215-220 ms: ~1
6. **Distribution of Z Key Generation Time:**
* X-axis: 3.3 to 3.7 ms
* Peak frequency: Around 9-10, between 3.3 and 3.4 ms.
* Frequencies:
* 3.3-3.4 ms: ~9-10
* 3.4-3.5 ms: ~9
* 3.5-3.6 ms: ~5
* 3.7-3.8 ms: ~1
7. **Distribution of Phase Two Ceremony Time:**
* X-axis: 2.325 to 2.525 ms
* Peak frequency: Around 8-9, between 2.375 and 2.400 ms.
* Frequencies:
* 2.325-2.350 ms: ~5
* 2.350-2.375 ms: ~7
* 2.375-2.400 ms: ~8-9
* 2.400-2.425 ms: ~4
* 2.425-2.450 ms: ~3
* 2.450-2.475 ms: ~3
* 2.500-2.525 ms: ~1
8. **Distribution of Verification Key Generation Time:**
* X-axis: 2.40 to 2.75 ms
* Peak frequency: Around 14, between 2.45 and 2.50 ms.
* Frequencies:
* 2.40-2.45 ms: ~12
* 2.45-2.50 ms: ~14
* 2.50-2.55 ms: ~10
* 2.65-2.70 ms: ~2
* 2.70-2.75 ms: ~1
9. **Distribution of Proof Generation Time:**
* X-axis: 2.50 to 2.75 ms
* Peak frequency: Around 9, between 2.50 and 2.55 ms.
* Frequencies:
* 2.50-2.55 ms: ~9
* 2.55-2.60 ms: ~7
* 2.60-2.65 ms: ~5
* 2.70-2.75 ms: ~2
10. **Distribution of Verifying Proof Time:**
* X-axis: 2.30 to 2.60 ms
* Peak frequency: Around 18, between 2.30 and 2.35 ms.
* Frequencies:
* 2.30-2.35 ms: ~18
* 2.35-2.40 ms: ~4
* 2.40-2.45 ms: ~3
* 2.55-2.60 ms: ~1
11. **Distribution of Solidity Verifier Generation Time:**
* X-axis: 2.24 to 2.34 ms
* Peak frequency: Around 7, between 2.28 and 2.30 ms.
* Frequencies:
* 2.24-2.26 ms: ~2
* 2.26-2.28 ms: ~6
* 2.28-2.30 ms: ~7
* 2.30-2.32 ms: ~6
* 2.32-2.34 ms: ~2
12. **Distribution of Total Time:**
* X-axis: 230 to 255 ms
* Peak frequency: Around 16-17, between 230 and 235 ms.
* Frequencies:
* 230-235 ms: ~16-17
* 235-240 ms: ~5
* 250-255 ms: ~1
### Key Observations
* Most distributions are right-skewed, indicating that the majority of operations complete relatively quickly, but there are occasional longer durations.
* The "Total Time" distribution has a significantly larger scale on the x-axis compared to the other distributions, reflecting the cumulative nature of the total time.
* Some stages, like "Phase Two Initiation Time" and "Verifying Proof Time," show a very sharp peak at the lower end of their time range.
### Interpretation
The histograms provide a visual representation of the time taken for various stages in a cryptographic process. The right-skewed distributions suggest that while most operations are efficient, occasional outliers or more complex inputs can lead to longer processing times. The "Total Time" distribution indicates the overall time required for the entire process, and its shape reflects the combined effect of the individual stages. Analyzing these distributions can help identify potential bottlenecks or areas for optimization within the cryptographic workflow. The data suggests that optimizing the "Phase Two Initiation Time" and "Verifying Proof Time" could have a significant impact on overall performance, given their high frequencies at the lower end of their respective time ranges.