## Histograms: Distribution of Blockchain Operation Times
### Overview
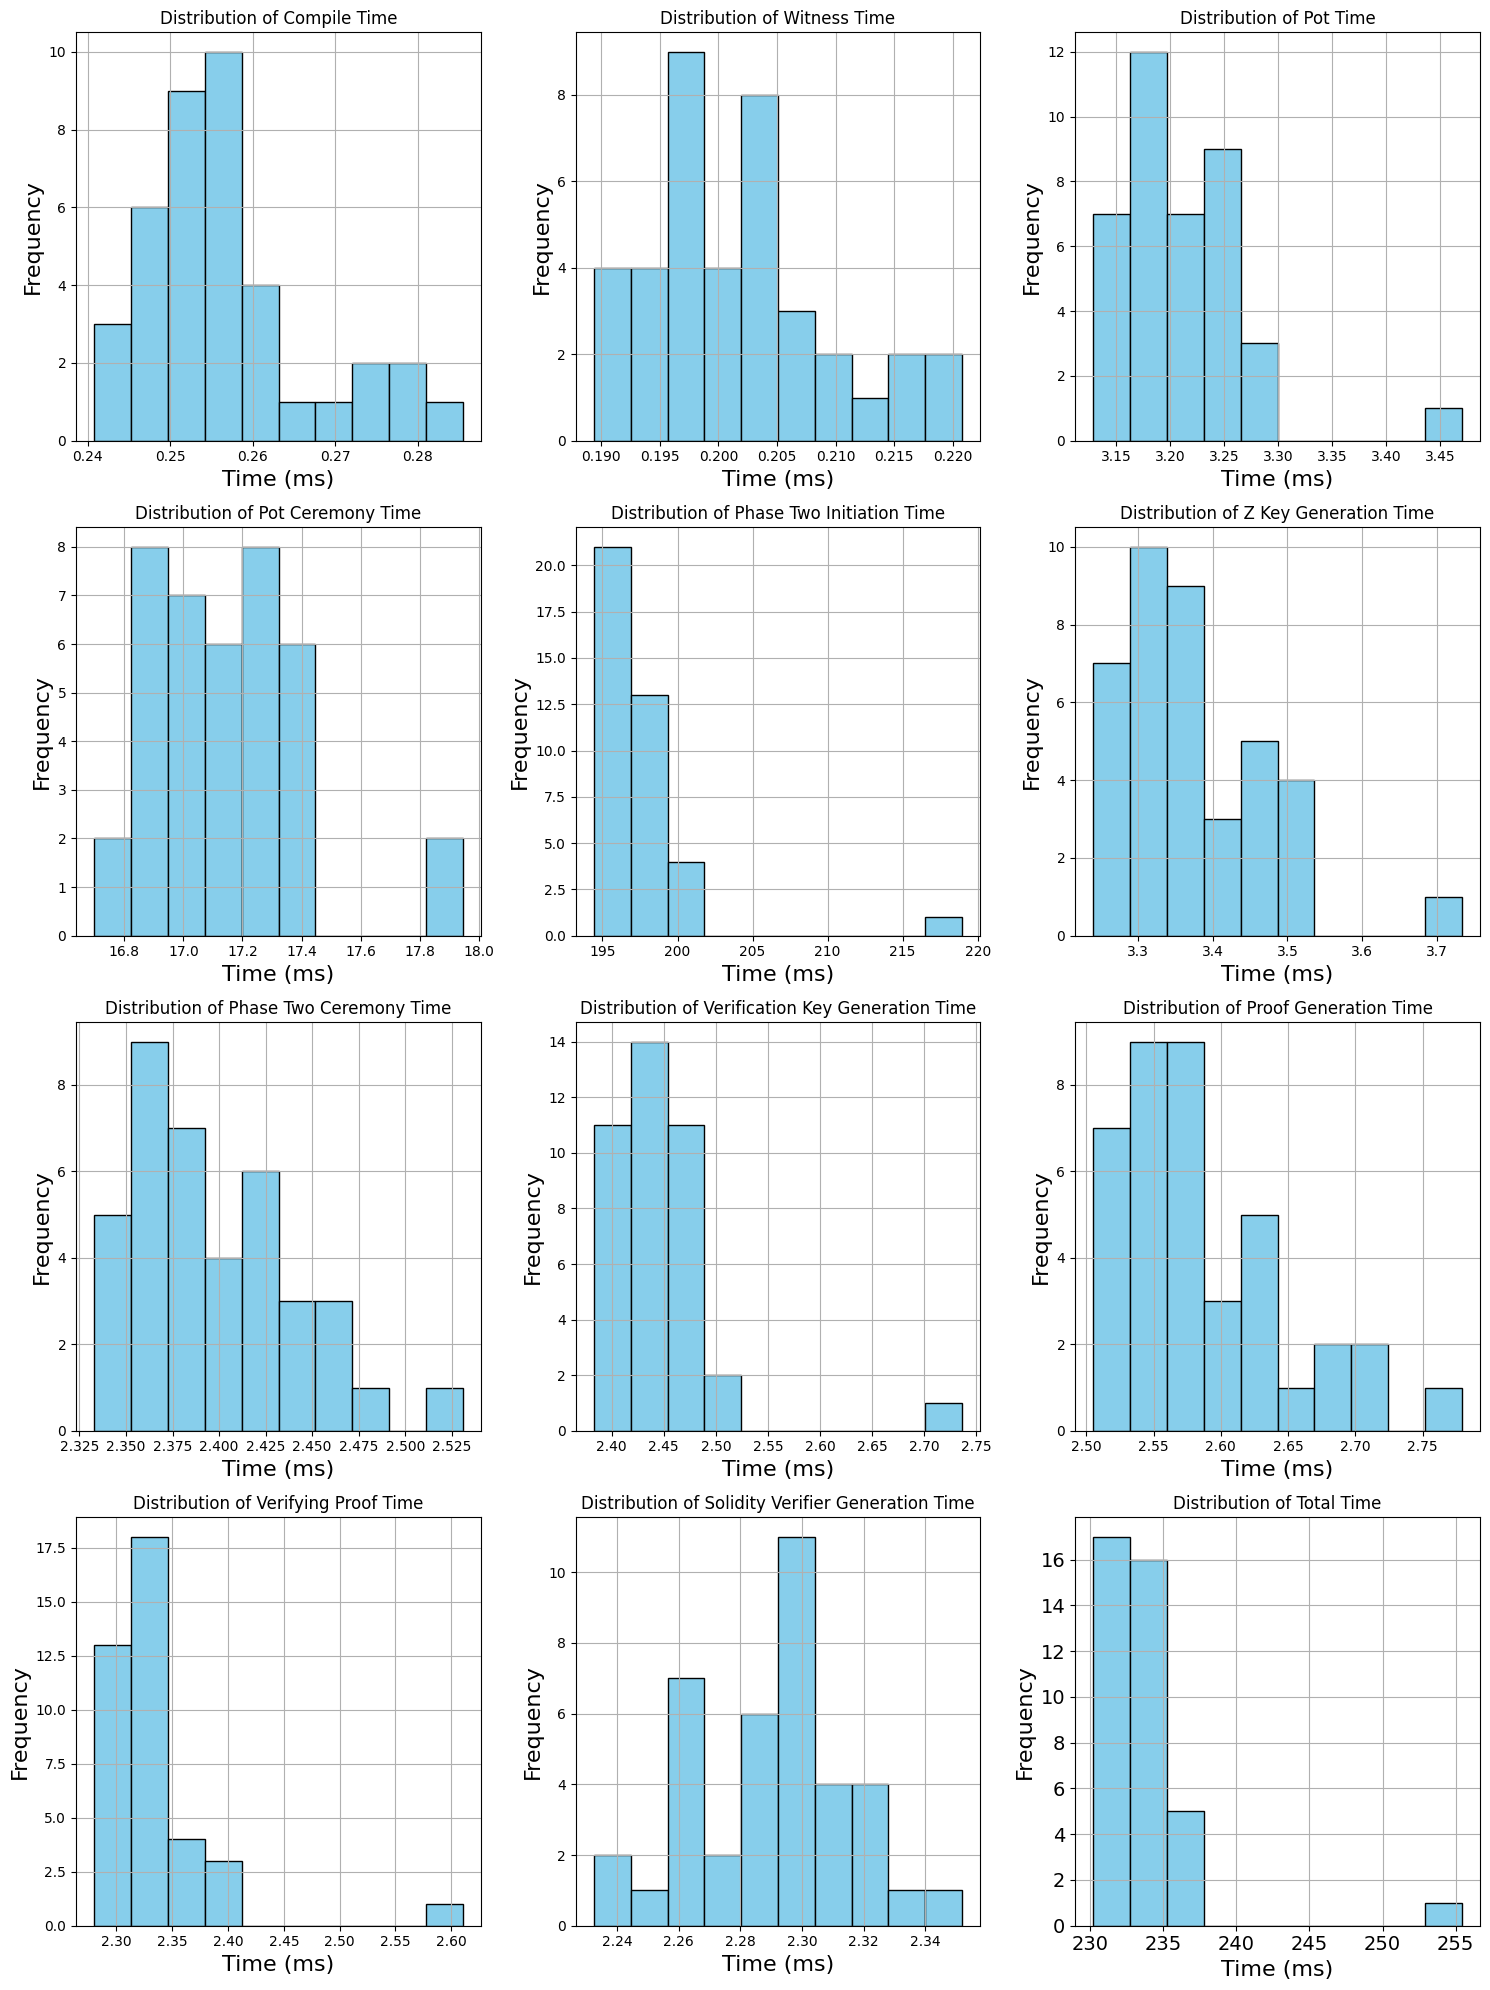
The image presents a 3x4 grid of histograms, each depicting the distribution of time taken for a specific operation within a blockchain system. The x-axis of each histogram represents time in milliseconds (ms), and the y-axis represents frequency. Each histogram shows the number of occurrences of operations falling within specific time intervals.
### Components/Axes
Each histogram shares the following components:
* **Title:** Indicates the specific operation being measured (e.g., "Distribution of Compile Time").
* **X-axis:** Labeled "Time (ms)". The scale varies for each histogram.
* **Y-axis:** Labeled "Frequency". The scale varies for each histogram.
* **Bars:** Represent the frequency of operations within each time interval.
The specific operations measured are:
1. Compile Time
2. Witness Time
3. Pot Time
4. Pot Ceremony Time
5. Phase Two Initiation Time
6. Z Key Generation Time
7. Phase Two Ceremony Time
8. Verification Key Generation Time
9. Proof Generation Time
10. Verifying Proof Time
11. Solidity Verifier Generation Time
12. Total Time
### Detailed Analysis or Content Details
**Row 1:**
1. **Distribution of Compile Time:** The histogram shows a peak frequency of approximately 9 around 0.26 ms. The distribution appears to be concentrated between 0.24 ms and 0.28 ms.
2. **Distribution of Witness Time:** The histogram peaks at approximately 7 around 0.205 ms. The distribution is relatively narrow, ranging from approximately 0.19 ms to 0.22 ms.
3. **Distribution of Pot Time:** The histogram peaks at approximately 11 around 3.30 ms. The distribution ranges from approximately 3.15 ms to 3.45 ms.
**Row 2:**
4. **Distribution of Pot Ceremony Time:** The histogram peaks at approximately 6 around 17.2 ms. The distribution ranges from approximately 16.8 ms to 18.0 ms.
5. **Distribution of Phase Two Initiation Time:** The histogram peaks at approximately 17.5 around 210 ms. The distribution ranges from approximately 190 ms to 220 ms.
6. **Distribution of Z Key Generation Time:** The histogram peaks at approximately 8 around 3.5 ms. The distribution ranges from approximately 3.3 ms to 3.7 ms.
**Row 3:**
7. **Distribution of Phase Two Ceremony Time:** The histogram peaks at approximately 6 around 2.425 ms. The distribution ranges from approximately 2.325 ms to 2.525 ms.
8. **Distribution of Verification Key Generation Time:** The histogram peaks at approximately 12 around 2.65 ms. The distribution ranges from approximately 2.40 ms to 2.75 ms.
9. **Distribution of Proof Generation Time:** The histogram peaks at approximately 7 around 2.65 ms. The distribution ranges from approximately 2.50 ms to 2.75 ms.
**Row 4:**
10. **Distribution of Verifying Proof Time:** The histogram peaks at approximately 3.5 around 2.45 ms. The distribution ranges from approximately 2.30 ms to 2.60 ms.
11. **Distribution of Solidity Verifier Generation Time:** The histogram peaks at approximately 4 around 2.55 ms. The distribution ranges from approximately 2.40 ms to 2.70 ms.
12. **Distribution of Total Time:** The histogram peaks at approximately 16 around 2.45 ms. The distribution ranges from approximately 2.20 ms to 2.70 ms.
### Key Observations
* **Compile Time** and **Witness Time** have the fastest operation times, measured in milliseconds.
* **Pot Ceremony Time** and **Phase Two Initiation Time** have significantly longer operation times, measured in tens to hundreds of milliseconds.
* **Total Time** has a wider distribution than most other operations, suggesting more variability.
* The distributions are generally unimodal (single peak), indicating a central tendency for each operation's duration.
### Interpretation
The histograms provide insights into the performance characteristics of different operations within a blockchain system. The varying distributions suggest that some operations are more predictable than others. The longer operation times for "Pot Ceremony Time" and "Phase Two Initiation Time" might indicate potential bottlenecks in the system. The wide distribution of "Total Time" suggests that the overall blockchain operation time is influenced by a combination of factors, and its duration can vary considerably.
The data suggests that optimizing the "Pot Ceremony Time" and "Phase Two Initiation Time" could lead to significant improvements in overall blockchain performance. The relatively consistent "Compile Time" and "Witness Time" suggest these operations are well-optimized. The "Total Time" distribution likely reflects the cumulative effect of all these operations, with the longer operations having a greater impact on the overall duration.