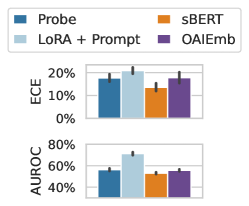
## Bar Chart: Performance Comparison of Methods on ECE and AUROC
### Overview
The image is a grouped bar chart comparing four methods (Probe, LoRA + Prompt, sBERT, OAIEmb) across two evaluation metrics: Expected Calibration Error (ECE) and Area Under the Receiver Operating Characteristic curve (AUROC). The chart uses color-coded bars with error bars to represent performance variability.
### Components/Axes
- **X-axis**: Method categories (Probe, LoRA + Prompt, sBERT, OAIEmb).
- **Y-axis (Top)**: ECE (%) ranging from 0% to 20%.
- **Y-axis (Bottom)**: AUROC (%) ranging from 40% to 80%.
- **Legend**: Located at the top-left, mapping colors to methods:
- Blue: Probe
- Light Blue: LoRA + Prompt
- Orange: sBERT
- Purple: OAIEmb
- **Error Bars**: Vertical lines on top of bars indicating variability (approx. 2-5% for ECE, 3-5% for AUROC).
### Detailed Analysis
#### ECE (Top Chart)
- **Probe (Blue)**: ~15% (±2%).
- **LoRA + Prompt (Light Blue)**: ~18% (±2%).
- **sBERT (Orange)**: ~12% (±1.5%).
- **OAIEmb (Purple)**: ~16% (±2.5%).
#### AUROC (Bottom Chart)
- **Probe (Blue)**: ~55% (±3%).
- **LoRA + Prompt (Light Blue)**: ~70% (±3%).
- **sBERT (Orange)**: ~50% (±2.5%).
- **OAIEmb (Purple)**: ~58% (±3.5%).
### Key Observations
1. **ECE**: All methods cluster between 12-18%, with LoRA + Prompt showing the highest error (18%) and sBERT the lowest (12%).
2. **AUROC**: LoRA + Prompt leads with ~70%, followed by OAIEmb (~58%), Probe (~55%), and sBERT (~50%).
3. **Error Bars**: Variability is smallest for sBERT in ECE and largest for OAIEmb in AUROC.
### Interpretation
- **Performance Trends**: LoRA + Prompt consistently outperforms other methods in both metrics, suggesting its effectiveness in balancing calibration and discrimination. OAIEmb shows moderate performance, while Probe and sBERT lag, particularly in AUROC.
- **Uncertainty**: Error bars indicate moderate variability, but the relative rankings remain stable across methods.
- **Notable Outliers**: sBERT underperforms in AUROC despite its low ECE, possibly due to trade-offs between calibration and discrimination. LoRA + Prompt’s high AUROC with relatively low ECE highlights its robustness.
This chart demonstrates that LoRA + Prompt is the most reliable method for the evaluated tasks, while sBERT’s lower AUROC suggests limitations in discriminative power despite better calibration.