\n
## State Transition Diagram: Binary Decision Tree with Transition Metrics
### Overview
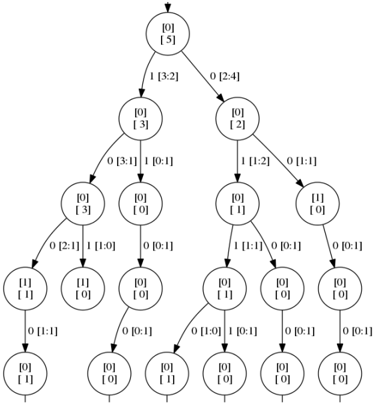
The image displays a hierarchical tree diagram, likely representing a state transition model, decision tree, or Markov chain. It consists of circular nodes connected by directed edges (arrows). Each node contains a pair of numbers in brackets, and each edge is labeled with a binary digit (0 or 1) followed by a pair of numbers in brackets. The tree originates from a single root node at the top and branches downward through multiple levels.
### Components/Axes
* **Nodes:** Circular elements representing states. Each node contains two numbers stacked vertically within brackets, e.g., `[0]` over `[5]`.
* **Edges:** Directed arrows connecting nodes, indicating possible transitions. Each edge has a label in the format: `X [A:B]`, where `X` is a binary digit (0 or 1), and `A` and `B` are integers.
* **Structure:** A rooted tree with a maximum depth of 5 levels (counting the root as level 0). The tree is asymmetric, with the left main branch being more developed than the right.
### Detailed Analysis
**Root Node (Level 0, Top Center):**
* Node Content: `[0]` over `[5]`
* Outgoing Edges:
* Left Edge: Label `1 [3:2]` → leads to Node L1.
* Right Edge: Label `0 [2:4]` → leads to Node R1.
**Level 1 Nodes:**
* **Node L1 (Left child of root):**
* Node Content: `[0]` over `[3]`
* Outgoing Edges:
* Left Edge: Label `0 [3:1]` → leads to Node L2a.
* Right Edge: Label `1 [0:1]` → leads to Node L2b.
* **Node R1 (Right child of root):**
* Node Content: `[0]` over `[2]`
* Outgoing Edges:
* Left Edge: Label `1 [1:2]` → leads to Node R2a.
* Right Edge: Label `0 [1:1]` → leads to Node R2b.
**Level 2 Nodes:**
* **Node L2a (Left child of L1):**
* Node Content: `[0]` over `[3]`
* Outgoing Edges:
* Left Edge: Label `0 [2:1]` → leads to Node L3a.
* Right Edge: Label `1 [1:0]` → leads to Node L3b.
* **Node L2b (Right child of L1):**
* Node Content: `[0]` over `[0]`
* Outgoing Edge:
* Single Edge: Label `0 [0:1]` → leads to Node L3c.
* **Node R2a (Left child of R1):**
* Node Content: `[0]` over `[1]`
* Outgoing Edges:
* Left Edge: Label `1 [1:1]` → leads to Node R3a.
* Right Edge: Label `0 [0:1]` → leads to Node R3b.
* **Node R2b (Right child of R1):**
* Node Content: `[1]` over `[0]`
* Outgoing Edge:
* Single Edge: Label `0 [0:1]` → leads to Node R3c.
**Level 3 Nodes:**
* **Node L3a (Left child of L2a):**
* Node Content: `[1]` over `[1]`
* Outgoing Edge:
* Single Edge: Label `0 [1:1]` → leads to Node L4a.
* **Node L3b (Right child of L2a):**
* Node Content: `[1]` over `[1]`
* Outgoing Edge:
* Single Edge: Label `0 [1:1]` → leads to Node L4b.
* **Node L3c (Child of L2b):**
* Node Content: `[0]` over `[0]`
* Outgoing Edge:
* Single Edge: Label `0 [0:1]` → leads to Node L4c.
* **Node R3a (Left child of R2a):**
* Node Content: `[0]` over `[1]`
* Outgoing Edges:
* Left Edge: Label `0 [1:0]` → leads to Node R4a.
* Right Edge: Label `1 [0:1]` → leads to Node R4b.
* **Node R3b (Right child of R2a):**
* Node Content: `[0]` over `[0]`
* Outgoing Edge:
* Single Edge: Label `0 [0:1]` → leads to Node R4c.
* **Node R3c (Child of R2b):**
* Node Content: `[0]` over `[0]`
* Outgoing Edge:
* Single Edge: Label `0 [0:1]` → leads to Node R4d.
**Level 4 Nodes (Leaf Nodes):**
* **Node L4a (Child of L3a):** Node Content: `[0]` over `[1]`
* **Node L4b (Child of L3b):** Node Content: `[0]` over `[0]`
* **Node L4c (Child of L3c):** Node Content: `[0]` over `[1]`
* **Node R4a (Left child of R3a):** Node Content: `[0]` over `[0]`
* **Node R4b (Right child of R3a):** Node Content: `[0]` over `[0]`
* **Node R4c (Child of R3b):** Node Content: `[0]` over `[0]`
* **Node R4d (Child of R3c):** Node Content: `[0]` over `[0]`
### Key Observations
1. **Node Value Pattern:** The top number in each node's bracket is predominantly `0`, with only two nodes (L3a, L3b) having a `1` in the top position. The bottom number varies more widely (0, 1, 2, 3, 5).
2. **Edge Label Pattern:** Every edge label begins with a binary digit (0 or 1). The numbers within the brackets `[A:B]` on the edges sum to a value that often, but not always, relates to the bottom number of the parent node. For example, the root's bottom number is 5, and its outgoing edges have `[3:2]` (sum 5) and `[2:4]` (sum 6).
3. **Tree Asymmetry:** The left subtree (originating from edge `1 [3:2]`) is deeper and contains nodes with higher bottom numbers (e.g., 3, 1, 1) compared to the right subtree, where most bottom numbers are 0 or 1.
4. **Terminal States:** All leaf nodes (Level 4) have a bottom number of either 0 or 1. The majority (5 out of 7) have `[0]` over `[0]`.
### Interpretation
This diagram likely models a sequential decision process or a stochastic system where:
* **Nodes** represent states, characterized by two metrics (the bracketed pair). The top number could be a binary flag (e.g., success/failure, active/inactive), and the bottom number could be a count, cost, or probability mass.
* **Edges** represent transitions triggered by a binary input or decision (`0` or `1`). The bracketed pair `[A:B]` on an edge might represent a cost, a probability distribution, or a resource allocation associated with taking that transition.
* The **asymmetry** suggests that the path initiated by a `1` at the root leads to a more complex or costly branch of the process (higher node values, more steps) than the path initiated by a `0`.
* The **convergence** to leaf nodes with `[0]` over `[0]` or `[0]` over `[1]` suggests these are absorbing or terminal states, possibly representing outcomes like "failure" (0) or "success" (1) with an associated final value.
Without explicit context, the exact meaning of the numbers is ambiguous, but the structure clearly maps out a state space with binary transitions and associated quantitative attributes. It could be used for analyzing algorithms, modeling system reliability, or mapping decision pathways.