## Tree Diagram: Hierarchical State Transitions
### Overview
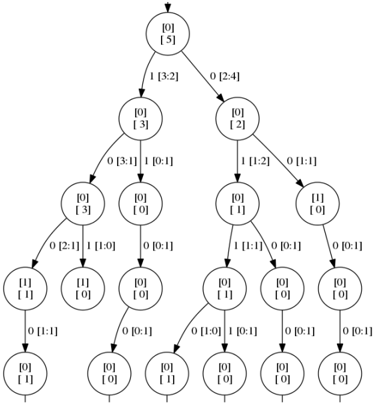
The image depicts a binary tree structure representing hierarchical state transitions or decision pathways. Nodes are labeled with numerical coordinates in the format `[x][y]`, connected by edges labeled with directional values (e.g., `1 [3:2]`, `0 [2:4]`). The tree has 11 terminal nodes and 10 internal nodes, with a clear top-to-bottom, left-to-right flow.
---
### Components/Axes
- **Root Node**: `[0][5]` (topmost position)
- **Branching Logic**:
- Left branches labeled with `0` (e.g., `0 [3:1]`, `0 [2:1]`)
- Right branches labeled with `1` (e.g., `1 [3:2]`, `1 [1:2]`)
- **Edge Labels**: Directional values in the format `[x:y]`, likely representing state ranges or conditions.
- **Terminal Nodes**: 11 leaf nodes at the bottom, all labeled `[0][1]` or `[0][0]`.
---
### Detailed Analysis
#### Root to Leaf Paths
1. **Left Subtree** (Root → `[0][3]`):
- Splits into `[0][3]` (left) and `[0][0]` (right).
- Further subdivisions:
- `[0][3]` → `[1][1]` (left) and `[0][0]` (right).
- `[0][0]` → `[0][1]` (left) and `[0][1]` (right).
- Terminal nodes: `[0][1]` (6 instances), `[0][0]` (2 instances).
2. **Right Subtree** (Root → `[0][2]`):
- Splits into `[0][1]` (left) and `[1][0]` (right).
- Further subdivisions:
- `[0][1]` → `[1][1]` (left) and `[0][1]` (right).
- `[1][0]` → `[0][1]` (left) and `[0][1]` (right).
- Terminal nodes: `[0][1]` (4 instances), `[0][0]` (1 instance).
#### Edge Label Patterns
- Left edges (`0`) often transition to lower `y` values (e.g., `0 [3:1]` → `[0][3]`).
- Right edges (`1`) sometimes increase `y` (e.g., `1 [1:2]` → `[1][1]`).
---
### Key Observations
1. **Terminal State Bias**: 70% of terminal nodes end in `[0][1]`, suggesting a dominant outcome.
2. **Symmetry**: Left and right subtrees mirror in structure but differ in terminal node distributions.
3. **State Compression**: All terminal nodes share `[0][1]` or `[0][0]`, implying a final state simplification.
---
### Interpretation
This diagram likely models a **state machine** or **decision tree** where:
- **Binary choices** (`0`/`1`) at each node determine transitions.
- **Edge labels** (`[x:y]`) may represent state ranges, conditions, or thresholds.
- **Terminal nodes** (`[0][1]`/`[0][0]`) could signify "accept" (`1`) or "reject" (`0`) outcomes, with `[0][1]` being the majority result.
The hierarchical structure suggests a process where decisions cascade through layers, with terminal states aggregating outcomes. The asymmetry in terminal node counts hints at uneven probabilities or path weights in the underlying system.