## Multiple Line Charts: NMSE vs. Iteration for Different Scenarios
### Overview
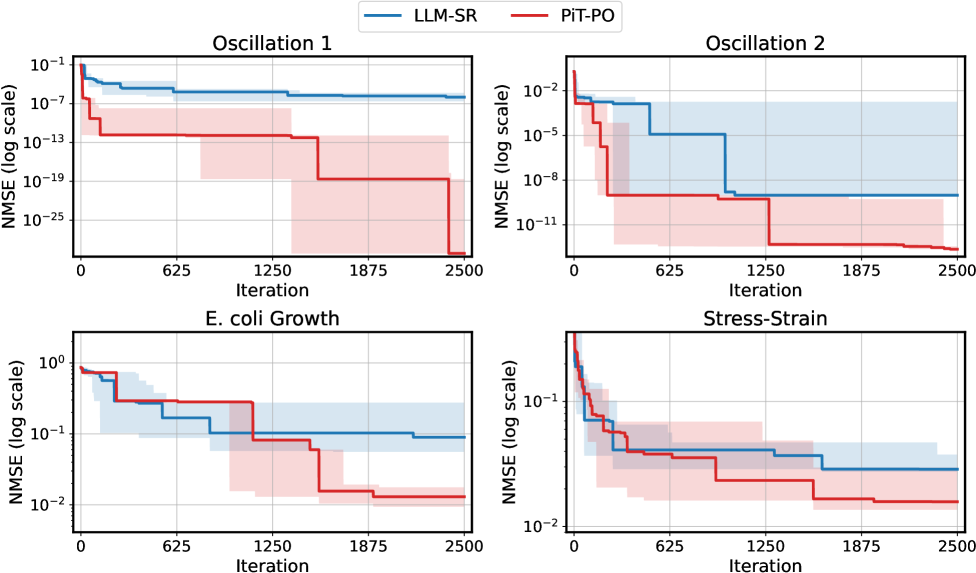
The image contains four line charts arranged in a 2x2 grid. Each chart plots the NMSE (Normalized Mean Squared Error) on a logarithmic scale against the iteration number. Two algorithms, LLM-SR (blue line) and PiT-PO (red line), are compared across four different scenarios: Oscillation 1, Oscillation 2, E. coli Growth, and Stress-Strain. Shaded regions around each line represent the uncertainty or variance associated with each algorithm's performance.
### Components/Axes
* **X-axis (all charts):** Iteration, with tick marks at 0, 625, 1250, 1875, and 2500.
* **Y-axis (all charts):** NMSE (log scale). The scale varies slightly between charts.
* Oscillation 1: 10^-25 to 10^-1
* Oscillation 2: 10^-11 to 10^-2
* E. coli Growth: 10^-2 to 10^0 (100)
* Stress-Strain: 10^-2 to 10^-1
* **Legend (top):** Located at the top of the image, spanning across the two top charts.
* LLM-SR: Blue line
* PiT-PO: Red line
* **Chart Titles:**
* Top-left: Oscillation 1
* Top-right: Oscillation 2
* Bottom-left: E. coli Growth
* Bottom-right: Stress-Strain
### Detailed Analysis
**1. Oscillation 1**
* **LLM-SR (blue):** The line starts at approximately 10^-1 and quickly drops to around 10^-6, where it remains relatively constant throughout the iterations.
* **PiT-PO (red):** The line starts around 10^-6, then drops in steps at approximately iterations 625, 1250, and 1875, reaching approximately 10^-24 by the end.
**2. Oscillation 2**
* **LLM-SR (blue):** The line starts at approximately 10^-2 and decreases to approximately 10^-6 by iteration 625, then remains relatively constant.
* **PiT-PO (red):** The line starts at approximately 10^-3 and decreases to approximately 10^-10 by iteration 1250, then remains relatively constant.
**3. E. coli Growth**
* **LLM-SR (blue):** The line starts at approximately 10^0 (100) and decreases to approximately 10^-1 by iteration 625, then remains relatively constant.
* **PiT-PO (red):** The line starts at approximately 10^0 (100) and decreases in steps at approximately iterations 625, 1250, and 1875, reaching approximately 10^-2 by the end.
**4. Stress-Strain**
* **LLM-SR (blue):** The line starts at approximately 10^-1 and decreases to approximately 10^-2 by iteration 1250, then remains relatively constant.
* **PiT-PO (red):** The line starts at approximately 10^-1 and decreases in steps at approximately iterations 625, 1250, and 1875, reaching approximately 10^-2 by the end.
### Key Observations
* In all four scenarios, both algorithms show a decrease in NMSE as the number of iterations increases, indicating improved performance over time.
* The PiT-PO algorithm tends to have more pronounced step-wise decreases in NMSE, while the LLM-SR algorithm often plateaus after an initial drop.
* The shaded regions indicate the variability in performance, with some scenarios showing wider bands than others.
### Interpretation
The charts compare the performance of two algorithms (LLM-SR and PiT-PO) in terms of NMSE across four different applications. The data suggests that both algorithms are effective in reducing error over iterations, but their convergence behavior differs. LLM-SR appears to converge quickly to a certain error level and then plateaus, while PiT-PO shows more gradual, step-wise improvements. The choice of algorithm may depend on the specific application and the desired trade-off between initial convergence speed and final error level. The shaded regions provide insight into the robustness of each algorithm, with wider bands indicating greater sensitivity to initial conditions or noise in the data.