TECHNICAL ASSET FINGERPRINT
703161d54fd2996cad09f7a1
Click to view fullscreen
Press ESC or click to close
FOUND IN PAPERS
EXPERT: healer-alpha-free VERSION 1
RUNTIME: free/openrouter/healer-alpha
INTEL_VERIFIED
## Comparative Performance Analysis of LLM-SR vs. PiT-PO Across Four Datasets
### Overview
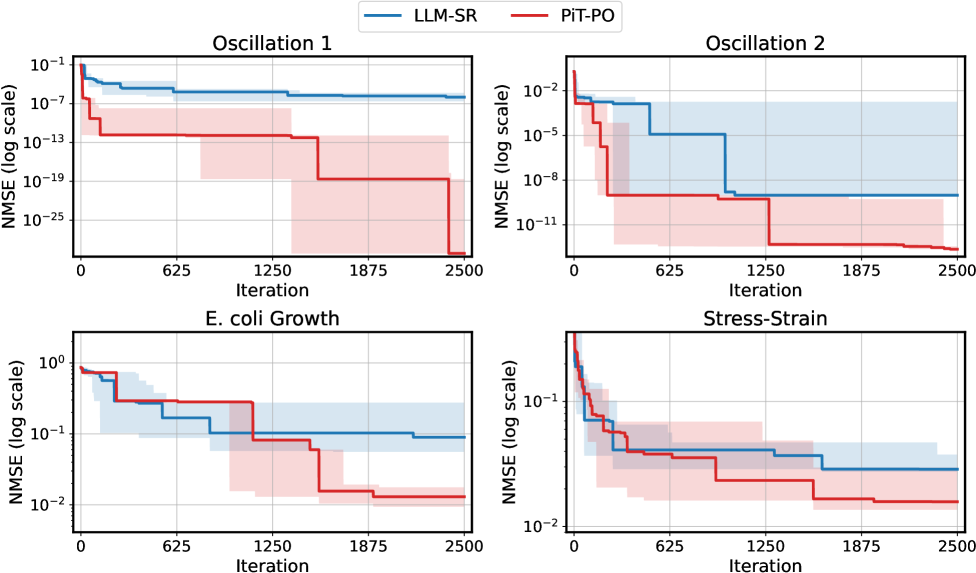
The image displays a 2x2 grid of four line charts. Each chart compares the performance of two methods, **LLM-SR** (blue line) and **PiT-PO** (red line), over 2500 iterations. Performance is measured by **NMSE (Normalized Mean Squared Error)** on a logarithmic scale. The four datasets or problems analyzed are titled "Oscillation 1", "Oscillation 2", "E. coli Growth", and "Stress-Strain". Shaded regions around each line represent confidence intervals or variability (light blue for LLM-SR, light red for PiT-PO).
### Components/Axes
* **Legend:** Located at the top center of the entire figure. It contains two entries:
* A blue line labeled **LLM-SR**.
* A red line labeled **PiT-PO**.
* **Common Axes:**
* **X-axis (all subplots):** Labeled **"Iteration"**. The scale is linear, with major tick marks at 0, 625, 1250, 1875, and 2500.
* **Y-axis (all subplots):** Labeled **"NMSE (log scale)"**. The scale is logarithmic, but the specific range varies per subplot.
* **Subplot Titles (Top Center of each chart):**
* Top-Left: **Oscillation 1**
* Top-Right: **Oscillation 2**
* Bottom-Left: **E. coli Growth**
* Bottom-Right: **Stress-Strain**
### Detailed Analysis
**1. Oscillation 1 (Top-Left Chart)**
* **Y-axis Range:** Approximately 10⁻¹ to 10⁻²⁵.
* **LLM-SR (Blue):** Starts near 10⁻¹. Shows a rapid initial drop, then plateaus around 10⁻⁷ by iteration ~200. It remains relatively flat at this level until iteration 2500. The confidence interval (light blue) is narrow.
* **PiT-PO (Red):** Starts near 10⁻¹. Drops sharply to ~10⁻¹³ by iteration ~100. It then exhibits a stepwise descent: a plateau until ~1300, a drop to ~10⁻¹⁹, another plateau until ~2400, and a final sharp drop to below 10⁻²⁵. The confidence interval (light red) is wider than LLM-SR's, especially between iterations 625-1875.
* **Trend:** Both methods improve (lower NMSE) over iterations. PiT-PO achieves a dramatically lower final error (by many orders of magnitude) and shows a distinct stepwise convergence pattern.
**2. Oscillation 2 (Top-Right Chart)**
* **Y-axis Range:** Approximately 10⁻² to 10⁻¹¹.
* **LLM-SR (Blue):** Starts near 10⁻². Drops to ~10⁻⁵ by iteration ~200, then to ~10⁻⁹ by iteration ~1000. It plateaus at ~10⁻⁹ for the remainder. The confidence interval is wide, spanning from ~10⁻⁵ to 10⁻¹¹ after iteration 1000.
* **PiT-PO (Red):** Starts near 10⁻². Drops very rapidly to ~10⁻⁹ by iteration ~200. It then shows a stepwise descent: a plateau until ~1300, a drop to ~10⁻¹², and a final slight decline to near 10⁻¹³ by iteration 2500. Its confidence interval is also wide but generally sits at a lower error range than LLM-SR's after iteration 200.
* **Trend:** PiT-PO converges much faster initially and reaches a lower final error. Both methods show significant variability (wide confidence bands) after the initial convergence phase.
**3. E. coli Growth (Bottom-Left Chart)**
* **Y-axis Range:** Approximately 10⁰ (1) to 10⁻².
* **LLM-SR (Blue):** Starts near 10⁰. Drops in steps to ~10⁻¹ by iteration ~200, then to ~10⁻¹.⁵ by iteration ~1000, and finally to ~10⁻¹.⁷ by iteration 2500. The confidence interval is very wide, spanning nearly the entire y-axis range after iteration 200.
* **PiT-PO (Red):** Starts near 10⁰. Follows a similar stepwise descent but consistently achieves lower error at each step. It reaches ~10⁻¹.⁵ by iteration ~200, ~10⁻¹.⁸ by iteration ~1300, and ~10⁻² by iteration 2500. Its confidence interval is also wide but centered at a lower error value than LLM-SR's.
* **Trend:** Both methods show stepwise improvement. PiT-PO consistently outperforms LLM-SR at each stage, achieving a final NMSE about an order of magnitude lower. The large confidence intervals suggest high variability in performance for both methods on this dataset.
**4. Stress-Strain (Bottom-Right Chart)**
* **Y-axis Range:** Approximately 10⁻¹ to 10⁻².
* **LLM-SR (Blue):** Starts near 10⁻¹. Drops rapidly to ~10⁻¹.⁵ by iteration ~200, then to ~10⁻¹.⁷ by iteration ~1000, and plateaus near ~10⁻¹.⁸ by iteration 2500. Confidence interval is moderately wide.
* **PiT-PO (Red):** Starts near 10⁻¹. Drops similarly to ~10⁻¹.⁵ by iteration ~200, then to ~10⁻¹.⁸ by iteration ~1000, and finally to ~10⁻² by iteration 2500. Its confidence interval is also moderately wide and overlaps with LLM-SR's in the early iterations but separates to a lower error range later.
* **Trend:** Both methods improve rapidly at first. PiT-PO shows a slight but consistent advantage in the later iterations (after ~1000), achieving a lower final error.
### Key Observations
1. **Consistent Superiority of PiT-PO:** In all four tasks, the **PiT-PO** method (red line) achieves a lower final NMSE than **LLM-SR** (blue line). The difference is most extreme in "Oscillation 1" (many orders of magnitude) and least pronounced in "Stress-Strain".
2. **Stepwise Convergence:** PiT-PO frequently exhibits a "stepwise" convergence pattern, where the error drops sharply, plateaus for several hundred iterations, and then drops again. This is visible in all charts but is most dramatic in "Oscillation 1".
3. **Convergence Speed:** PiT-PO generally converges faster in the very early iterations (first ~200), reaching a lower error level more quickly than LLM-SR.
4. **Variability (Confidence Intervals):** Both methods show significant performance variability, as indicated by the wide shaded confidence intervals. This variability is particularly large for the "E. coli Growth" and "Oscillation 2" tasks. Despite this, the central trend (solid line) for PiT-PO is consistently lower.
5. **Task Difficulty:** The scale of the final NMSE varies greatly by task, from ~10⁻²⁵ ("Oscillation 1") to ~10⁻² ("E. coli Growth", "Stress-Strain"), indicating these problems have vastly different inherent difficulties or error scales.
### Interpretation
The data strongly suggests that the **PiT-PO** method is more effective and efficient than **LLM-SR** for the class of problems represented by these four datasets. Its key advantages are:
* **Higher Accuracy:** It consistently reaches a lower error floor.
* **Faster Initial Convergence:** It reduces error more rapidly in the early stages of optimization.
* **Potential for Deep Convergence:** The stepwise pattern, especially in "Oscillation 1", suggests PiT-PO may be capable of escaping local minima or finding progressively better solutions over long runs, whereas LLM-SR tends to plateau earlier.
The wide confidence intervals indicate that the performance of both methods can be variable, likely depending on initial conditions or stochastic elements in the algorithms. However, the consistent positioning of the PiT-PO trend line below the LLM-SR trend line across all tasks and iterations provides robust evidence for its relative superiority in this comparison. The "Oscillation" tasks, which likely involve fitting periodic functions, show the most dramatic performance gap, hinting that PiT-PO may be particularly well-suited for such problems.
DECODING INTELLIGENCE...