## Chart Type: Multi-Chart Comparison of LLM-SR and PiT-PO Performance
### Overview
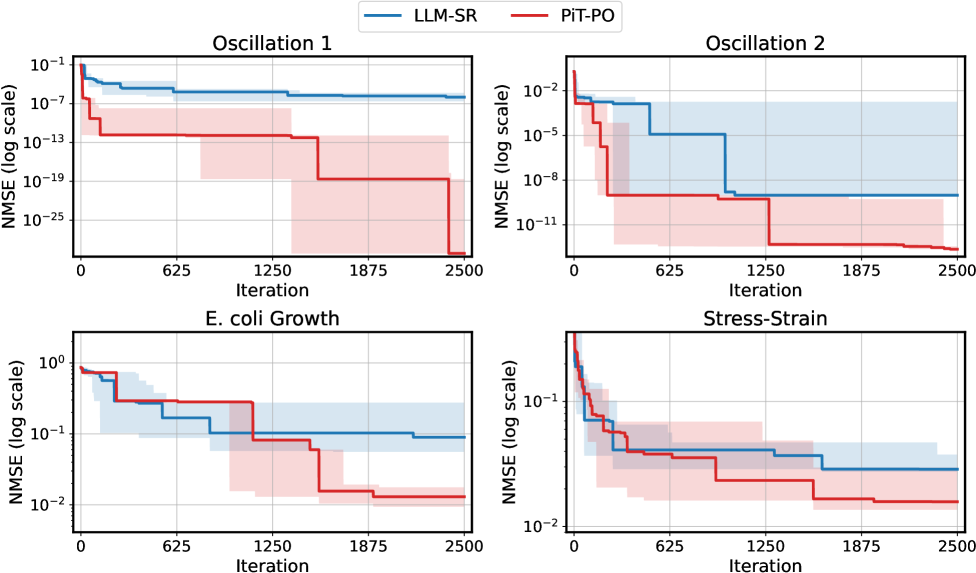
The image contains four sub-charts arranged in a 2x2 grid, comparing the performance of two methods (LLM-SR and PiT-PO) across four datasets: Oscillation 1, Oscillation 2, E. coli Growth, and Stress-Strain. Each chart plots Normalized Mean Squared Error (NMSE) on a logarithmic scale against iteration steps (0–2500). Shaded regions represent uncertainty intervals for each method.
### Components/Axes
- **X-axis**: "Iteration" (0–2500), linear scale.
- **Y-axis**: "NMSE (log scale)" ranging from 10⁻²⁵ to 10⁰.
- **Legends**:
- Blue line/shade: LLM-SR.
- Red line/shade: PiT-PO.
- **Sub-chart Titles**:
- Top-left: Oscillation 1
- Top-right: Oscillation 2
- Bottom-left: E. coli Growth
- Bottom-right: Stress-Strain
### Detailed Analysis
#### Oscillation 1
- **LLM-SR (Blue)**:
- Starts at ~10⁻¹, decreases stepwise to ~10⁻¹³ by iteration 625, then plateaus.
- Uncertainty (shaded blue) narrows significantly after iteration 625.
- **PiT-PO (Red)**:
- Begins at ~10⁻⁷, drops to ~10⁻¹³ by iteration 625, then plateaus.
- Uncertainty (shaded red) widens slightly after iteration 1250.
#### Oscillation 2
- **LLM-SR (Blue)**:
- Starts at ~10⁻², decreases to ~10⁻⁸ by iteration 625, then plateaus.
- Uncertainty narrows sharply after iteration 625.
- **PiT-PO (Red)**:
- Begins at ~10⁻⁵, drops to ~10⁻¹¹ by iteration 1250, then plateaus.
- Uncertainty widens after iteration 1250.
#### E. coli Growth
- **LLM-SR (Blue)**:
- Starts near 10⁰, decreases stepwise to ~10⁻¹ by iteration 625, then plateaus.
- Uncertainty narrows after iteration 625.
- **PiT-PO (Red)**:
- Begins near 10⁰, drops to ~10⁻² by iteration 1250, then plateaus.
- Uncertainty widens slightly after iteration 1250.
#### Stress-Strain
- **LLM-SR (Blue)**:
- Starts at ~10⁻¹, decreases to ~10⁻² by iteration 625, then plateaus.
- Uncertainty narrows after iteration 625.
- **PiT-PO (Red)**:
- Begins at ~10⁻¹, drops to ~10⁻² by iteration 1250, then plateaus.
- Uncertainty widens slightly after iteration 1250.
### Key Observations
1. **Performance Trends**:
- LLM-SR consistently shows higher initial NMSE but converges faster in most datasets (e.g., Oscillation 1, E. coli Growth).
- PiT-PO starts with lower NMSE in Oscillation 2 and Stress-Strain but plateaus at higher error levels.
2. **Uncertainty Patterns**:
- LLM-SR’s uncertainty decreases with iterations, suggesting improved reliability over time.
- PiT-PO’s uncertainty increases in later iterations (e.g., Oscillation 1, Stress-Strain), indicating potential instability.
3. **Convergence**:
- Both methods plateau by ~1875 iterations, but LLM-SR achieves lower final NMSE in most cases.
### Interpretation
The data suggests that **LLM-SR** is more effective at reducing error over time across most datasets, despite higher initial uncertainty. Its narrowing uncertainty intervals imply increasing confidence in predictions. **PiT-PO**, while starting with lower error in some cases (e.g., Oscillation 2), exhibits higher final NMSE and growing uncertainty, which may indicate limitations in handling complex or dynamic datasets. The divergence in performance highlights trade-offs between initial accuracy and long-term reliability, with LLM-SR favoring robustness and PiT-PO prioritizing early precision. Further investigation into dataset-specific factors (e.g., noise, nonlinearity) could clarify these trends.