## Heatmap: Dataset Performance Comparison
### Overview
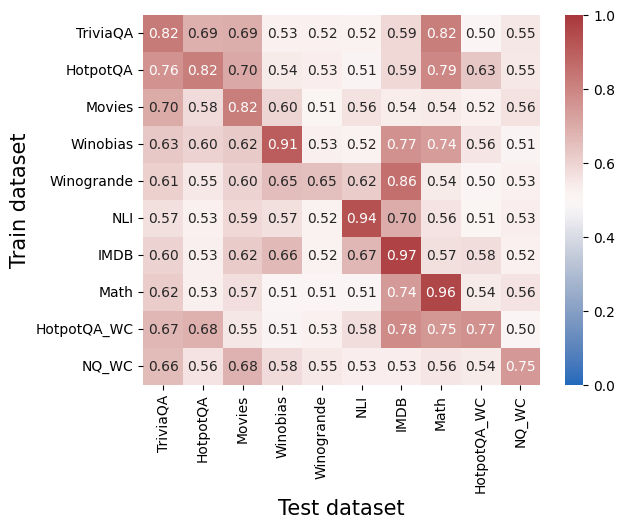
The image is a heatmap visualizing the performance of models trained on different datasets and tested on different datasets. The color intensity represents the performance score, ranging from blue (low) to red (high). The x-axis represents the "Test dataset" and the y-axis represents the "Train dataset".
### Components/Axes
* **X-axis (Test dataset):** TriviaQA, HotpotQA, Movies, Winobias, Winogrande, NLI, IMDB, Math, HotpotQA\_WC, NQ\_WC
* **Y-axis (Train dataset):** TriviaQA, HotpotQA, Movies, Winobias, Winogrande, NLI, IMDB, Math, HotpotQA\_WC, NQ\_WC
* **Color Scale:** Ranges from 0.0 (blue) to 1.0 (red), with intermediate shades representing values in between.
### Detailed Analysis
The heatmap displays performance scores for each combination of training and testing datasets. The values are explicitly written in each cell.
Here's a breakdown of the values:
* **TriviaQA:**
* Trained on TriviaQA: 0.82
* Trained on HotpotQA: 0.69
* Trained on Movies: 0.69
* Trained on Winobias: 0.53
* Trained on Winogrande: 0.52
* Trained on NLI: 0.52
* Trained on IMDB: 0.59
* Trained on Math: 0.82
* Trained on HotpotQA\_WC: 0.50
* Trained on NQ\_WC: 0.55
* **HotpotQA:**
* Trained on TriviaQA: 0.76
* Trained on HotpotQA: 0.82
* Trained on Movies: 0.70
* Trained on Winobias: 0.54
* Trained on Winogrande: 0.53
* Trained on NLI: 0.51
* Trained on IMDB: 0.59
* Trained on Math: 0.79
* Trained on HotpotQA\_WC: 0.63
* Trained on NQ\_WC: 0.55
* **Movies:**
* Trained on TriviaQA: 0.70
* Trained on HotpotQA: 0.58
* Trained on Movies: 0.82
* Trained on Winobias: 0.60
* Trained on Winogrande: 0.51
* Trained on NLI: 0.56
* Trained on IMDB: 0.54
* Trained on Math: 0.54
* Trained on HotpotQA\_WC: 0.52
* Trained on NQ\_WC: 0.56
* **Winobias:**
* Trained on TriviaQA: 0.63
* Trained on HotpotQA: 0.60
* Trained on Movies: 0.62
* Trained on Winobias: 0.91
* Trained on Winogrande: 0.53
* Trained on NLI: 0.52
* Trained on IMDB: 0.77
* Trained on Math: 0.74
* Trained on HotpotQA\_WC: 0.56
* Trained on NQ\_WC: 0.51
* **Winogrande:**
* Trained on TriviaQA: 0.61
* Trained on HotpotQA: 0.55
* Trained on Movies: 0.60
* Trained on Winobias: 0.65
* Trained on Winogrande: 0.65
* Trained on NLI: 0.62
* Trained on IMDB: 0.86
* Trained on Math: 0.54
* Trained on HotpotQA\_WC: 0.50
* Trained on NQ\_WC: 0.53
* **NLI:**
* Trained on TriviaQA: 0.57
* Trained on HotpotQA: 0.53
* Trained on Movies: 0.59
* Trained on Winobias: 0.57
* Trained on Winogrande: 0.52
* Trained on NLI: 0.94
* Trained on IMDB: 0.70
* Trained on Math: 0.56
* Trained on HotpotQA\_WC: 0.51
* Trained on NQ\_WC: 0.53
* **IMDB:**
* Trained on TriviaQA: 0.60
* Trained on HotpotQA: 0.53
* Trained on Movies: 0.62
* Trained on Winobias: 0.66
* Trained on Winogrande: 0.52
* Trained on NLI: 0.67
* Trained on IMDB: 0.97
* Trained on Math: 0.57
* Trained on HotpotQA\_WC: 0.58
* Trained on NQ\_WC: 0.52
* **Math:**
* Trained on TriviaQA: 0.62
* Trained on HotpotQA: 0.53
* Trained on Movies: 0.57
* Trained on Winobias: 0.51
* Trained on Winogrande: 0.51
* Trained on NLI: 0.51
* Trained on IMDB: 0.74
* Trained on Math: 0.96
* Trained on HotpotQA\_WC: 0.54
* Trained on NQ\_WC: 0.56
* **HotpotQA\_WC:**
* Trained on TriviaQA: 0.67
* Trained on HotpotQA: 0.68
* Trained on Movies: 0.55
* Trained on Winobias: 0.51
* Trained on Winogrande: 0.53
* Trained on NLI: 0.58
* Trained on IMDB: 0.78
* Trained on Math: 0.75
* Trained on HotpotQA\_WC: 0.77
* Trained on NQ\_WC: 0.50
* **NQ\_WC:**
* Trained on TriviaQA: 0.66
* Trained on HotpotQA: 0.56
* Trained on Movies: 0.68
* Trained on Winobias: 0.58
* Trained on Winogrande: 0.55
* Trained on NLI: 0.53
* Trained on IMDB: 0.53
* Trained on Math: 0.56
* Trained on HotpotQA\_WC: 0.54
* Trained on NQ\_WC: 0.75
### Key Observations
* The diagonal elements (training and testing on the same dataset) generally have higher scores, indicating that models perform best on data similar to what they were trained on.
* IMDB and Math datasets show high performance when trained and tested on themselves (0.97 and 0.96 respectively).
* Winobias and NLI also show high performance when trained and tested on themselves (0.91 and 0.94 respectively).
* Cross-dataset performance varies, with some datasets showing better generalization than others.
### Interpretation
The heatmap illustrates the transferability of models across different datasets. Training a model on a specific dataset and testing it on the same dataset generally yields the best performance. However, the performance drops when the model is tested on a different dataset, indicating that the models are not perfectly generalizable. The extent of the performance drop varies depending on the similarity between the training and testing datasets. For example, models trained on TriviaQA perform relatively well on HotpotQA, suggesting that these two datasets share some common characteristics. Conversely, models trained on NQ\_WC tend to perform worse on other datasets. The high diagonal values suggest that the models are learning dataset-specific features, rather than generalizable knowledge.