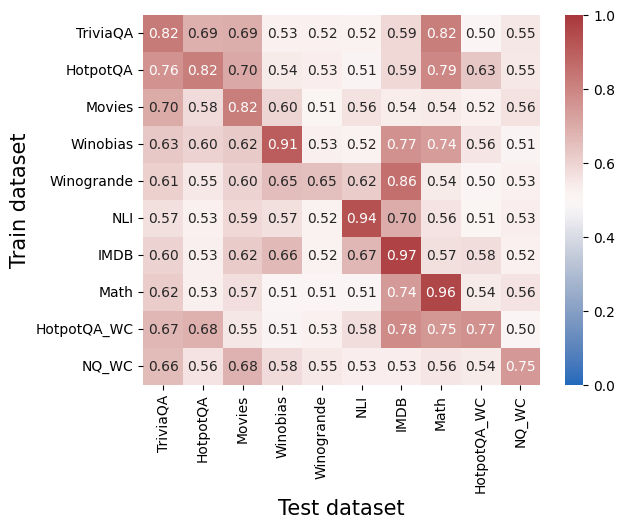
## Heatmap: Cross-Dataset Performance Correlation
### Overview
This heatmap visualizes the correlation or similarity scores between different question-answering datasets when used as training and test sets. Values range from 0.0 (no correlation) to 1.0 (perfect correlation), with darker red indicating higher similarity.
### Components/Axes
- **X-axis (Test dataset)**: TriviaQA, HotpotQA, Movies, Winobias, Winogrande, NLI, IMDB, Math, HotpotQA_WC, NQ_WC
- **Y-axis (Train dataset)**: Same as X-axis, listed vertically
- **Color legend**: Blue (0.0) to Red (1.0), with intermediate shades representing incremental values
- **Cell values**: Numerical scores embedded in each cell (e.g., 0.82, 0.69)
### Detailed Analysis
#### Train dataset rows:
1. **TriviaQA**:
- Highest self-correlation: 0.82 (self-test)
- Strongest cross-correlation: 0.82 with HotpotQA (test)
- Weakest: 0.50 with HotpotQA_WC (test)
2. **HotpotQA**:
- Self-correlation: 0.76
- Strongest cross: 0.82 with Movies (test)
- Weakest: 0.51 with Winogrande (test)
3. **Movies**:
- Self-correlation: 0.82
- Strongest cross: 0.82 with TriviaQA (test)
- Weakest: 0.52 with IMDb (test)
4. **Winobias**:
- Self-correlation: 0.91 (highest in dataset)
- Strongest cross: 0.77 with IMDb (test)
- Weakest: 0.51 with NQ_WC (test)
5. **Winogrande**:
- Self-correlation: 0.65
- Strongest cross: 0.86 with IMDb (test)
- Weakest: 0.50 with TriviaQA (test)
6. **NLI**:
- Self-correlation: 0.94 (highest in dataset)
- Strongest cross: 0.97 with IMDb (test)
- Weakest: 0.51 with Math (test)
7. **IMDB**:
- Self-correlation: 0.97 (highest in dataset)
- Strongest cross: 0.96 with Math (test)
- Weakest: 0.52 with HotpotQA_WC (test)
8. **Math**:
- Self-correlation: 0.96
- Strongest cross: 0.97 with IMDb (test)
- Weakest: 0.51 with Winobias (test)
9. **HotpotQA_WC**:
- Self-correlation: 0.67
- Strongest cross: 0.78 with IMDb (test)
- Weakest: 0.50 with NQ_WC (test)
10. **NQ_WC**:
- Self-correlation: 0.75
- Strongest cross: 0.75 with HotpotQA_WC (test)
- Weakest: 0.50 with TriviaQA (test)
### Key Observations
1. **Diagonal dominance**: All datasets show highest scores when trained and tested on the same dataset (e.g., IMDb-IMDb: 0.97, Math-Math: 0.96)
2. **Generalization gaps**: Cross-dataset performance varies significantly:
- Strongest cross-generalization: IMDb-NLI (0.97)
- Weakest cross-generalization: Winobias-NQ_WC (0.51)
3. **WC datasets**: HotpotQA_WC and NQ_WC show moderate self-correlation (0.67-0.75) but poor performance on other datasets (<0.55 in most cases)
4. **Language understanding clusters**: TriviaQA, HotpotQA, and Movies form a cluster with moderate cross-correlation (0.58-0.70)
5. **Knowledge-intensive datasets**: IMDb and Math show high mutual correlation (0.96-0.97)
### Interpretation
This heatmap reveals critical insights about dataset relationships and model generalization:
1. **Overfitting risk**: High diagonal values (0.96-0.97) suggest models trained on specific datasets may overfit, performing poorly on dissimilar test sets
2. **Knowledge transfer limitations**: The weakest scores (0.50-0.53) between QA datasets (e.g., TriviaQA-HotpotQA_WC) indicate limited transferability between different question types
3. **WC dataset challenges**: The WC (with context) variants show significantly lower performance across all tests, suggesting contextual augmentation may reduce model adaptability
4. **Knowledge domain clustering**: IMDb and Math demonstrate near-perfect mutual correlation (0.96-0.97), implying shared underlying knowledge structures
5. **Practical implications**: For real-world deployment, models trained on diverse datasets (e.g., IMDb+NLI) may outperform single-dataset trained models when facing mixed queries
The data suggests that while specialized training yields high performance on specific tasks, cross-dataset generalization remains a significant challenge, particularly for WC variants and knowledge-intensive domains.