\n
## Bar Chart: CoC (LM state)
### Overview
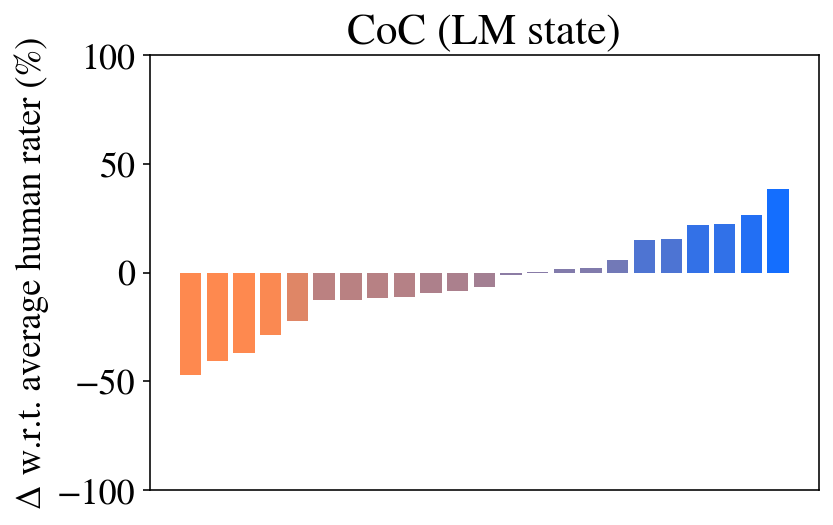
The image presents a bar chart visualizing the difference (Δ) with respect to an average human rater (%) for a "CoC (LM state)" metric. The chart displays a series of bars, transitioning from negative values to positive values, suggesting a shift in performance or assessment relative to human raters.
### Components/Axes
* **Title:** "CoC (LM state)" - positioned at the top-center of the chart.
* **Y-axis Label:** "Δ w.r.t. average human rater (%)" - positioned on the left side of the chart. The scale ranges from approximately -100% to 100%.
* **X-axis:** No explicit labels are visible on the x-axis, indicating categorical data points. The number of data points is approximately 20.
* **Bars:** The chart consists of a series of vertical bars, colored in shades of orange, purple, and blue.
### Detailed Analysis
The bars transition from orange (negative values) to purple (values around 0) and then to blue (positive values).
* **Initial Orange Bars (approximately x=1 to x=8):** These bars show negative differences, ranging from approximately -10% to -60%. The trend is decreasing from left to right.
* Bar 1: Approximately -10%
* Bar 2: Approximately -20%
* Bar 3: Approximately -25%
* Bar 4: Approximately -30%
* Bar 5: Approximately -35%
* Bar 6: Approximately -40%
* Bar 7: Approximately -50%
* Bar 8: Approximately -60%
* **Purple Bars (approximately x=9 to x=15):** These bars show values close to zero, fluctuating around the 0% mark.
* Bar 9: Approximately -5%
* Bar 10: Approximately 0%
* Bar 11: Approximately 5%
* Bar 12: Approximately 0%
* Bar 13: Approximately 5%
* Bar 14: Approximately 10%
* Bar 15: Approximately 10%
* **Blue Bars (approximately x=16 to x=20):** These bars show positive differences, increasing in magnitude from left to right.
* Bar 16: Approximately 15%
* Bar 17: Approximately 20%
* Bar 18: Approximately 30%
* Bar 19: Approximately 40%
* Bar 20: Approximately 50%
### Key Observations
The chart demonstrates a clear trend: initially, the "CoC (LM state)" metric is significantly lower than the average human rater. However, as the data points progress, the metric gradually approaches and then surpasses the human rater's performance. The transition from negative to positive values indicates a point where the LM state begins to outperform the average human rater.
### Interpretation
The data suggests that the "CoC (LM state)" initially underperforms compared to human raters, but with progression (potentially representing increasing complexity or training), it improves and eventually exceeds human-level performance. This could indicate that the LM state requires a certain level of input or training before it can effectively match or surpass human capabilities. The sharp increase in the final bars suggests a potential inflection point where the LM state demonstrates a significant advantage. The metric "CoC (LM state)" is not defined, but it is likely a measure of consistency or correctness. The chart is a performance comparison between a Language Model (LM) state and an average human rater. The x-axis likely represents some form of progression or iteration.