## Horizontal Bar Chart: AI Model Accuracy Comparison
### Overview
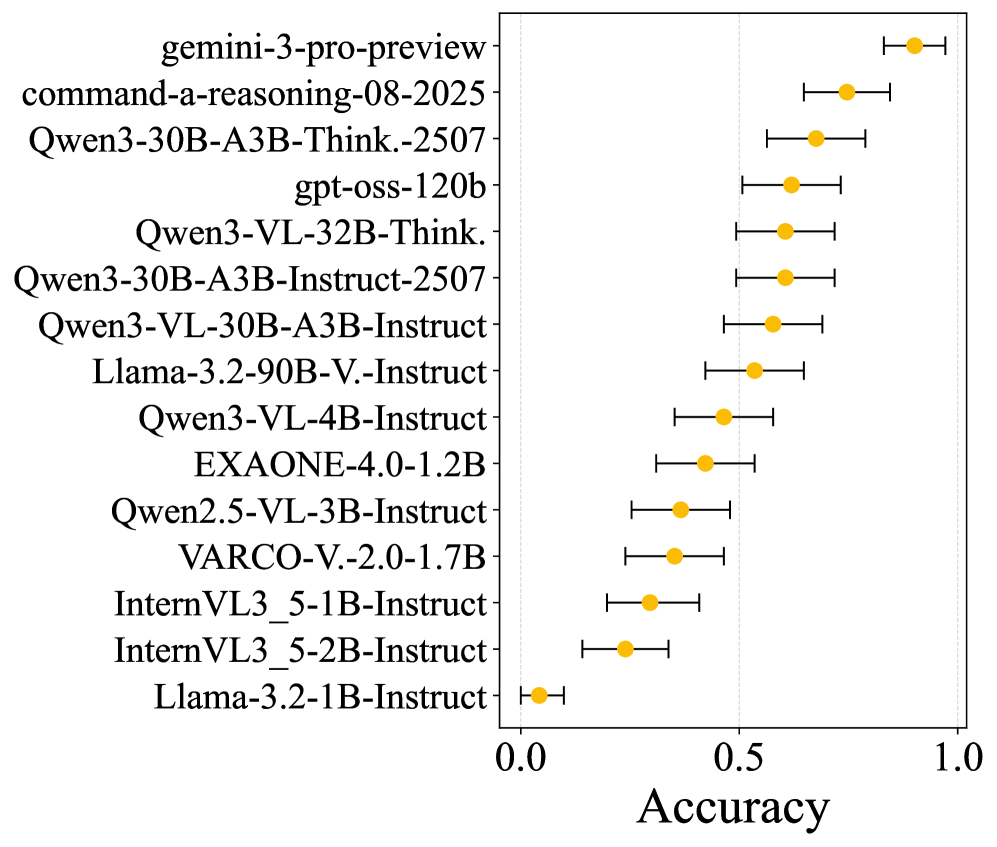
The chart compares the accuracy of various AI models on a task, with models listed on the y-axis and accuracy values (0.0–1.0) on the x-axis. Each model is represented by an orange data point with error bars, indicating variability in performance.
### Components/Axes
- **X-axis (Accuracy)**: Labeled "Accuracy" with a scale from 0.0 to 1.0 in increments of 0.1.
- **Y-axis (Models)**: Lists AI model names in descending order of accuracy.
- **Data Points**: Orange circles with black error bars (horizontal lines extending left/right from each point).
- **Legend**: Not explicitly visible in the image.
### Detailed Analysis
1. **Model Rankings**:
- **Highest Accuracy**: `gemini-3-pro-preview` (~0.85 ± error bar).
- **Second**: `command-a-reasoning-08-2025` (~0.8 ± error bar).
- **Third**: `Qwen3-30B-A3B-Think-2507` (~0.78 ± error bar).
- **Lowest**: `Llama-3.2-1B-Instruct` (~0.05 ± error bar).
2. **Error Bars**: All models show error bars, but their magnitude is not quantified (e.g., ±0.05, ±0.1). The bars suggest variability in performance across test cases.
3. **Model Categories**:
- **Large Models**: `gemini-3-pro-preview`, `Qwen3-30B-A3B-Think-2507`, `Qwen3-VL-30B-A3B-Instruct`.
- **Mid-Sized Models**: `gpt-oss-120b`, `Qwen3-VL-32B-Think`, `Llama-3.2-90B-V-Instruct`.
- **Smaller Models**: `EXAONE-4.0-1.2B`, `VARCO-V-2.0-1.7B`, `InternVL3_5-1B-Instruct`, `Llama-3.2-1B-Instruct`.
### Key Observations
- **Performance Gradient**: Accuracy decreases significantly from the top models (~0.85) to the lowest (~0.05), indicating a strong correlation between model size/complexity and performance.
- **Error Bar Consistency**: All models have error bars, but their lengths vary. Larger models (e.g., `gemini-3-pro-preview`) have shorter error bars, suggesting more consistent performance.
- **Outliers**: `Llama-3.2-1B-Instruct` stands out as the lowest-performing model, with accuracy ~17x lower than the top model.
### Interpretation
The chart demonstrates that larger, more complex models (e.g., Gemini, Qwen3) achieve higher accuracy, likely due to advanced architectures or training data. Smaller models (e.g., Llama-3.2-1B-Instruct) lag significantly, highlighting the trade-off between computational resources and performance. The error bars suggest that even top models have variability, but their consistency (shorter bars) makes them more reliable. The absence of a legend or error quantification limits precise comparisons, but the visual trend is clear: **model scale correlates with accuracy**.