## Line Chart: Performance Profile
### Overview
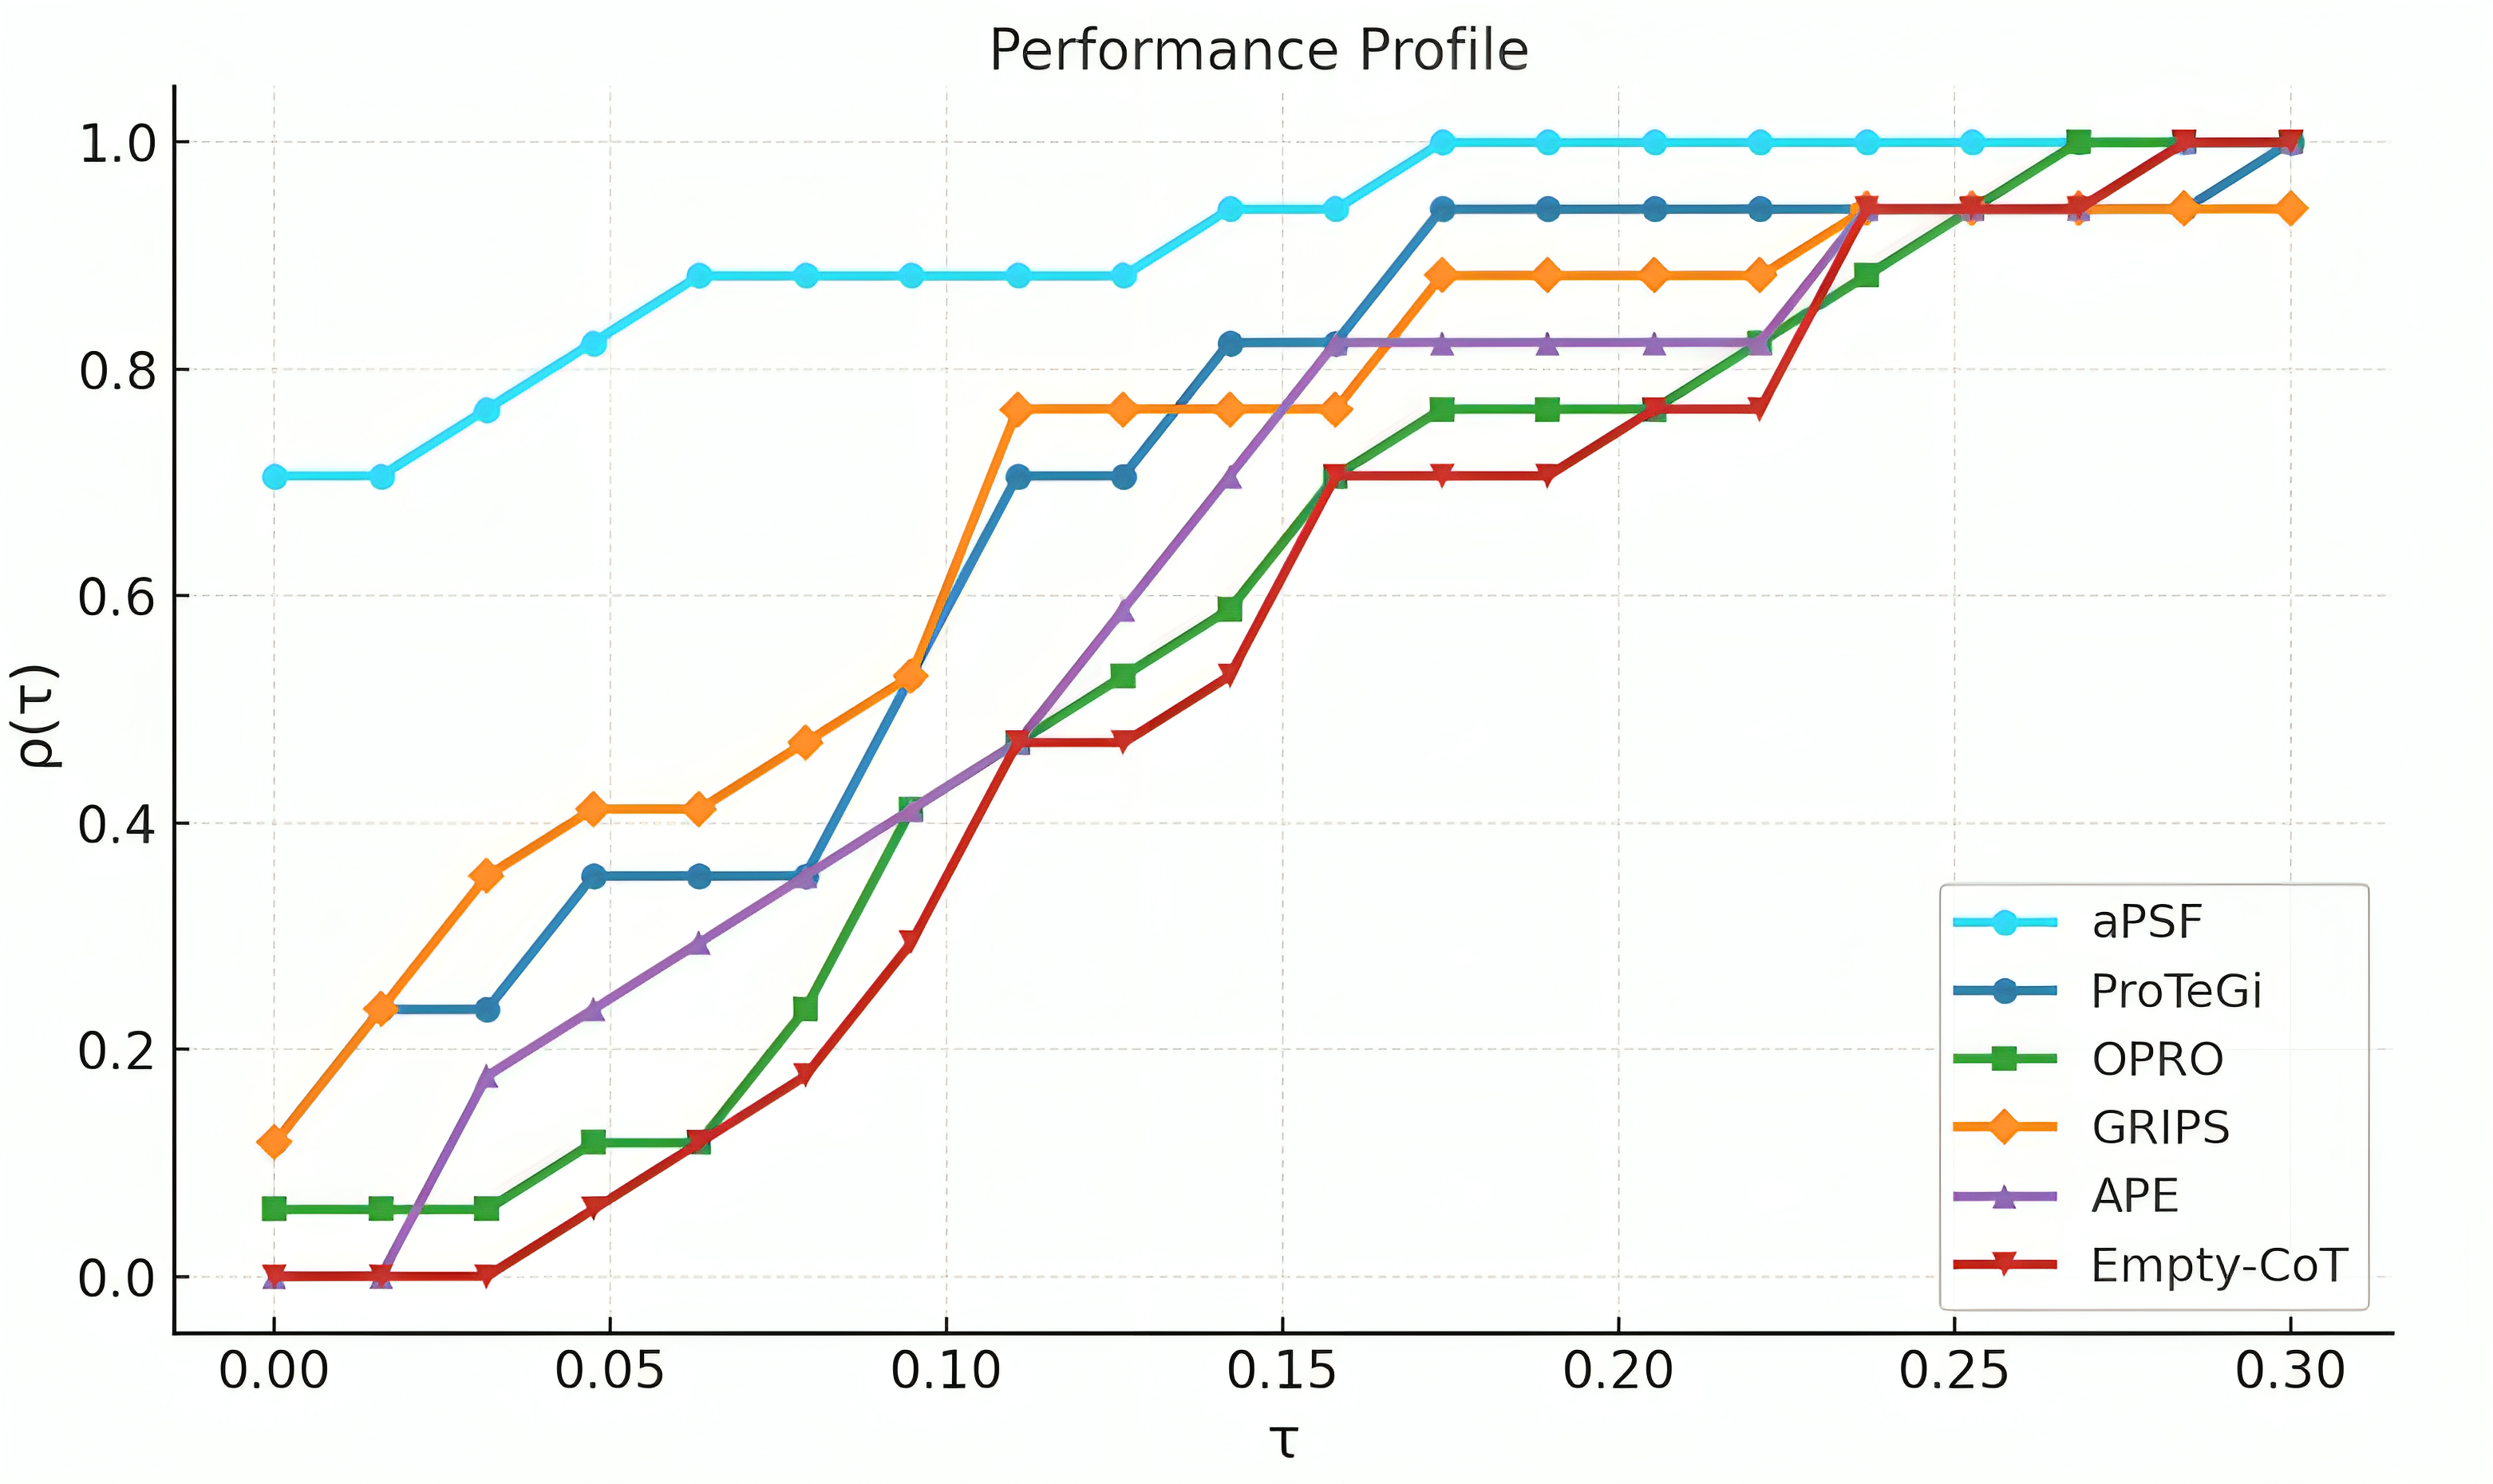
The chart displays the performance profiles of six algorithms (aPSF, ProTeGi, OPRO, GRIPS, APE, Empty-CoT) across a parameter τ ranging from 0.00 to 0.30. Performance (ρ(τ)) is measured on the y-axis (0.0–1.0), with each algorithm represented by a distinct colored line and marker. All lines exhibit stepwise increases, with performance plateauing at higher τ values.
### Components/Axes
- **X-axis (τ)**: Ranges from 0.00 to 0.30 in increments of 0.05. Labeled "τ".
- **Y-axis (ρ(τ))**: Performance metric, ranging from 0.0 to 1.0 in increments of 0.2. Labeled "ρ(τ)".
- **Legend**: Located in the bottom-right corner, mapping colors to algorithms:
- Cyan (○): aPSF
- Dark Blue (○): ProTeGi
- Green (■): OPRO
- Orange (◆): GRIPS
- Purple (▲): APE
- Red (▼): Empty-CoT
### Detailed Analysis
1. **aPSF (Cyan)**:
- Starts at ρ(τ) ≈ 0.7 at τ=0.00.
- Increases to ≈0.8 at τ=0.05, then plateaus at ≈0.9 until τ=0.30.
- Final value: ρ(τ) ≈ 1.0 at τ=0.30.
2. **ProTeGi (Dark Blue)**:
- Begins at ρ(τ) ≈ 0.2 at τ=0.00.
- Rises to ≈0.4 at τ=0.05, ≈0.7 at τ=0.10, ≈0.9 at τ=0.15, and plateaus at ≈0.95 until τ=0.30.
- Final value: ρ(τ) ≈ 1.0 at τ=0.30.
3. **OPRO (Green)**:
- Starts at ρ(τ) ≈ 0.05 at τ=0.00.
- Increases to ≈0.2 at τ=0.05, ≈0.5 at τ=0.10, ≈0.75 at τ=0.15, ≈0.85 at τ=0.20, and reaches 1.0 by τ=0.25.
- Final value: ρ(τ) ≈ 1.0 at τ=0.30.
4. **GRIPS (Orange)**:
- Begins at ρ(τ) ≈ 0.1 at τ=0.00.
- Rises to ≈0.4 at τ=0.05, ≈0.8 at τ=0.10, ≈0.85 at τ=0.15, and plateaus at ≈0.9 until τ=0.30.
- Final value: ρ(τ) ≈ 0.9 at τ=0.30.
5. **APE (Purple)**:
- Starts at ρ(τ) ≈ 0.0 at τ=0.00.
- Increases to ≈0.2 at τ=0.05, ≈0.5 at τ=0.10, ≈0.8 at τ=0.15, ≈0.85 at τ=0.20, and reaches 1.0 by τ=0.25.
- Final value: ρ(τ) ≈ 1.0 at τ=0.30.
6. **Empty-CoT (Red)**:
- Begins at ρ(τ) ≈ 0.0 at τ=0.00.
- Rises to ≈0.1 at τ=0.05, ≈0.4 at τ=0.10, ≈0.6 at τ=0.15, ≈0.75 at τ=0.20, and reaches 1.0 by τ=0.25.
- Final value: ρ(τ) ≈ 1.0 at τ=0.30.
### Key Observations
- **aPSF** maintains the highest performance across all τ values, plateauing near 1.0 early.
- **ProTeGi** and **APE** show similar trajectories, with APE surpassing ProTeGi after τ=0.15.
- **Empty-CoT** starts the lowest but accelerates sharply, matching aPSF by τ=0.25.
- **OPRO** and **GRIPS** exhibit moderate growth, with OPRO outperforming GRIPS after τ=0.10.
- All algorithms converge to ρ(τ) ≈ 1.0 by τ=0.30, except GRIPS, which plateaus at ≈0.9.
### Interpretation
The chart demonstrates varying algorithm efficiency across τ. aPSF and ProTeGi are top performers, while Empty-CoT shows rapid improvement, suggesting potential for optimization. The convergence of lines at higher τ values implies that performance differences may diminish with increased parameter scaling. GRIPS lags slightly behind others, indicating possible limitations in its design or implementation. The stepwise nature of the lines suggests discrete performance thresholds or algorithmic decision points.