# Technical Document Extraction: Real-World Denoising Efficiency (PolyU)
## Chart Type
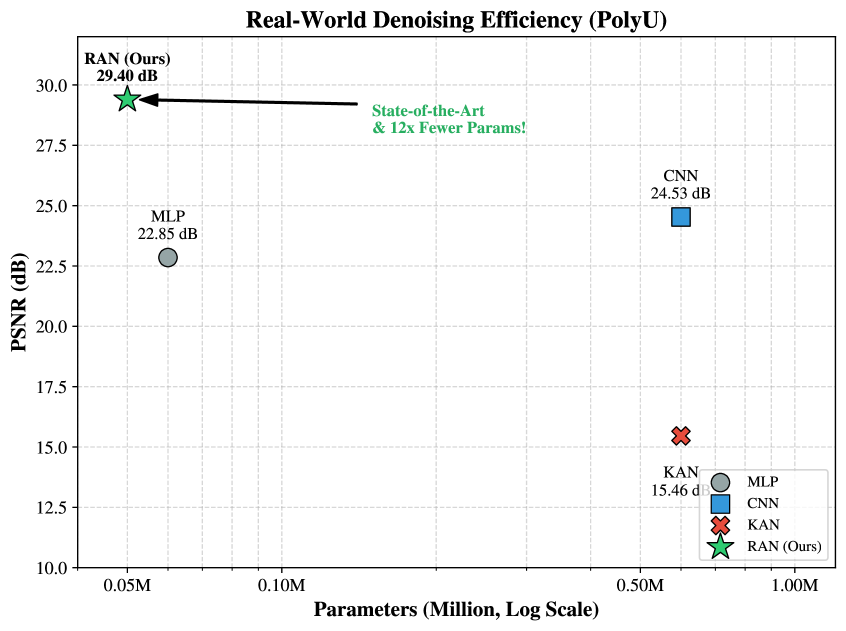
Scatter plot comparing denoising efficiency metrics across different neural network architectures.
## Axes
- **X-axis**: "Parameters (Million, Log Scale)"
- Range: 0.05M to 1.00M (logarithmic scale)
- Tick marks: 0.05M, 0.10M, 0.50M, 1.00M
- **Y-axis**: "PSNR (dB)"
- Range: 10.0 to 30.0 dB
- Tick marks: 10.0, 12.5, 15.0, 17.5, 20.0, 22.5, 25.0, 27.5, 30.0
## Legend
- **Location**: Bottom-right corner
- **Entries**:
1. **MLP**: Gray circle
2. **CNN**: Blue square
3. **KAN**: Red cross
4. **RAN (Ours)**: Green star
## Data Points & Annotations
1. **MLP**
- **Color**: Gray circle
- **Position**: [0.05M, 22.85 dB]
- **Label**: "MLP 22.85 dB"
2. **CNN**
- **Color**: Blue square
- **Position**: [0.5M, 24.53 dB]
- **Label**: "CNN 24.53 dB"
3. **KAN**
- **Color**: Red cross
- **Position**: [0.55M, 15.46 dB]
- **Label**: "KAN 15.46 dB"
4. **RAN (Ours)**
- **Color**: Green star
- **Position**: [0.05M, 29.40 dB]
- **Label**: "RAN (Ours) 29.40 dB"
- **Annotation**: Arrow pointing to RAN with text:
> "State-of-the-Art & 12x Fewer Params!"
## Key Trends
- **RAN (Ours)** achieves the highest PSNR (29.40 dB) while using the fewest parameters (0.05M), outperforming all other architectures.
- **CNN** achieves moderate PSNR (24.53 dB) at 0.5M parameters.
- **MLP** achieves 22.85 dB at 0.05M parameters but lags behind RAN.
- **KAN** has the lowest PSNR (15.46 dB) at 0.55M parameters.
## Spatial Grounding
- **Legend**: Bottom-right quadrant (x > 0.5M, y < 15 dB).
- **Data Points**:
- RAN (green star) is the top-leftmost point.
- KAN (red cross) is the bottom-rightmost point.
## Component Isolation
1. **Header**: Chart title "Real-World Denoising Efficiency (PolyU)" in bold black text.
2. **Main Chart**:
- Grid lines: Dashed gray lines at x = 0.05M, 0.10M, 0.50M, 1.00M and y = 10.0, 12.5, ..., 30.0.
- Data points: Four distinct markers (circle, square, cross, star) with labels.
3. **Footer**: Legend box with color-coded labels.
## Verification
- **Color Consistency**: All data points match legend colors.
- **Trend Logic**:
- RAN (green star) dominates in efficiency (high PSNR, low parameters).
- KAN (red cross) underperforms in both metrics.
- CNN and MLP show intermediate performance.
## Conclusion
The chart demonstrates that RAN (Ours) achieves state-of-the-art denoising efficiency with significantly fewer parameters compared to MLP, CNN, and KAN.