# Technical Data Extraction: Real-World Denoising Efficiency (PolyU)
## 1. Document Metadata
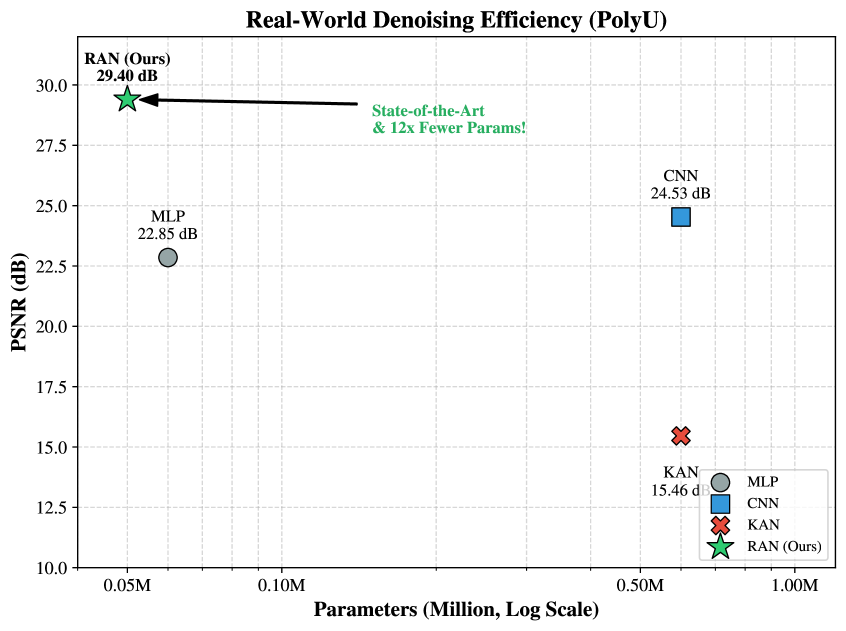
* **Title:** Real-World Denoising Efficiency (PolyU)
* **Type:** Scatter Plot (Performance vs. Model Complexity)
* **Primary Language:** English
## 2. Axis Specifications
* **Y-Axis (Vertical):**
* **Label:** PSNR (dB)
* **Scale:** Linear, ranging from 10.0 to 30.0+ (increments of 2.5 marked).
* **Significance:** Higher values indicate better image restoration quality.
* **X-Axis (Horizontal):**
* **Label:** Parameters (Million, Log Scale)
* **Scale:** Logarithmic. Major markers at 0.05M, 0.10M, 0.50M, and 1.00M.
* **Significance:** Lower values indicate a more lightweight/efficient model.
## 3. Legend and Component Isolation
The legend is located in the bottom-right quadrant of the chart area.
| Symbol | Color | Label | Description |
| :--- | :--- | :--- | :--- |
| Circle | Grey | MLP | Multi-Layer Perceptron baseline |
| Square | Blue | CNN | Convolutional Neural Network baseline |
| X-mark | Red | KAN | Kolmogorov-Arnold Network baseline |
| Star | Green | RAN (Ours) | Proposed Rational Activation Network |
## 4. Data Point Extraction and Trend Analysis
The chart compares four distinct architectures. There is a clear trade-off trend where traditional models (CNN, KAN) require significantly more parameters to achieve their results, while the proposed RAN model breaks this trend by being both the most accurate and the most efficient.
### Data Table
| Model | Parameters (Approx. X-position) | PSNR (dB) | Visual Position |
| :--- | :--- | :--- | :--- |
| **RAN (Ours)** | ~0.05M | **29.40 dB** | Top-Left (High Performance, Low Complexity) |
| **MLP** | ~0.06M | 22.85 dB | Mid-Left |
| **CNN** | ~0.60M | 24.53 dB | Mid-Right |
| **KAN** | ~0.60M | 15.46 dB | Bottom-Right (Low Performance, High Complexity) |
## 5. Key Annotations and Insights
* **Primary Callout:** A black arrow points from the center of the chart toward the **RAN (Ours)** data point.
* **Annotation Text:** "State-of-the-art & 12x Fewer Params!" (Text color: Green).
* **Efficiency Comparison:** The RAN model achieves the highest PSNR (29.40 dB) while positioned at the far left of the log-scale x-axis (~0.05M parameters).
* **Performance Gap:** RAN outperforms the next best model (CNN) by **4.87 dB** while utilizing roughly **1/12th** of the parameters (comparing ~0.05M to ~0.60M).
* **KAN Performance:** The KAN model, despite having a high parameter count (~0.60M), shows the lowest performance at 15.46 dB.
## 6. Summary of Findings
The visualization demonstrates that the **RAN (Ours)** architecture provides a significant breakthrough in denoising efficiency on the PolyU dataset. It occupies the "ideal" quadrant of the graph (top-left), representing a Pareto improvement over MLP, CNN, and KAN architectures by simultaneously maximizing signal-to-noise ratio and minimizing computational footprint.