## Chart: Model Performance Comparison
### Overview
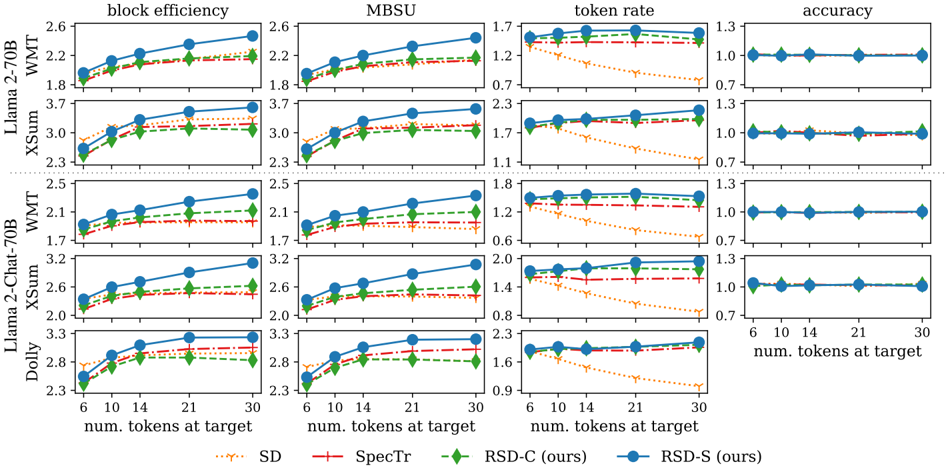
The image presents a series of line graphs comparing the performance of different models (Llama 2-70B, Llama 2-Chat-70B, Dolly) on various tasks (WMT, XSum) across four metrics: block efficiency, MBSU, token rate, and accuracy. The x-axis represents the number of tokens at the target (6, 10, 14, 21, 30). Four different methods (SD, SpecTr, RSD-C, RSD-S) are compared within each task and metric combination.
### Components/Axes
* **Title:** Model Performance Comparison (derived from the content)
* **X-axis:** "num. tokens at target" with values 6, 10, 14, 21, 30.
* **Y-axes:**
* **Block efficiency:** Ranges from approximately 1.7 to 3.7.
* **MBSU:** Ranges from approximately 0.6 to 3.3.
* **Token rate:** Ranges from approximately 0.6 to 2.3.
* **Accuracy:** Ranges from approximately 0.7 to 1.3.
* **Models (Rows):**
* Llama 2-70B (WMT, XSum)
* Llama 2-Chat-70B (WMT, XSum)
* Dolly
* **Metrics (Columns):**
* block efficiency
* MBSU
* token rate
* accuracy
* **Legend (Bottom):**
* SD (orange dotted line with downward-pointing triangle markers)
* SpecTr (red dashed-dotted line with plus markers)
* RSD-C (ours) (green dashed line with diamond markers)
* RSD-S (ours) (blue solid line with circle markers)
### Detailed Analysis
#### Llama 2-70B - WMT
* **Block efficiency:**
* SD (orange): Increases from ~1.8 to ~2.1.
* SpecTr (red): Increases from ~1.9 to ~2.2.
* RSD-C (green): Increases from ~1.9 to ~2.3.
* RSD-S (blue): Increases from ~2.0 to ~2.5.
* **MBSU:**
* SD (orange): Increases from ~1.8 to ~2.0.
* SpecTr (red): Increases from ~1.8 to ~2.1.
* RSD-C (green): Increases from ~1.9 to ~2.2.
* RSD-S (blue): Increases from ~2.0 to ~2.4.
* **Token rate:**
* SD (orange): Decreases from ~1.7 to ~1.0.
* SpecTr (red): Remains relatively constant at ~1.7.
* RSD-C (green): Remains relatively constant at ~1.7.
* RSD-S (blue): Remains relatively constant at ~1.7.
* **Accuracy:** All methods remain constant at ~1.0.
#### Llama 2-70B - XSum
* **Block efficiency:**
* SD (orange): Increases from ~2.7 to ~3.3.
* SpecTr (red): Increases from ~2.8 to ~3.2.
* RSD-C (green): Increases from ~2.9 to ~3.3.
* RSD-S (blue): Increases from ~2.9 to ~3.6.
* **MBSU:**
* SD (orange): Increases from ~2.7 to ~3.1.
* SpecTr (red): Increases from ~2.7 to ~3.0.
* RSD-C (green): Increases from ~2.8 to ~3.1.
* RSD-S (blue): Increases from ~2.8 to ~3.6.
* **Token rate:**
* SD (orange): Decreases from ~2.3 to ~1.2.
* SpecTr (red): Remains relatively constant at ~2.1.
* RSD-C (green): Remains relatively constant at ~2.1.
* RSD-S (blue): Remains relatively constant at ~2.1.
* **Accuracy:** All methods remain constant at ~1.0.
#### Llama 2-Chat-70B - WMT
* **Block efficiency:**
* SD (orange): Increases from ~1.7 to ~1.9.
* SpecTr (red): Increases from ~1.8 to ~2.1.
* RSD-C (green): Increases from ~1.8 to ~2.2.
* RSD-S (blue): Increases from ~1.9 to ~2.4.
* **MBSU:**
* SD (orange): Increases from ~1.7 to ~1.9.
* SpecTr (red): Increases from ~1.8 to ~2.0.
* RSD-C (green): Increases from ~1.8 to ~2.2.
* RSD-S (blue): Increases from ~1.9 to ~2.4.
* **Token rate:**
* SD (orange): Decreases from ~1.7 to ~0.8.
* SpecTr (red): Remains relatively constant at ~1.6.
* RSD-C (green): Remains relatively constant at ~1.6.
* RSD-S (blue): Remains relatively constant at ~1.7.
* **Accuracy:** All methods remain constant at ~1.0.
#### Llama 2-Chat-70B - XSum
* **Block efficiency:**
* SD (orange): Increases from ~2.3 to ~2.6.
* SpecTr (red): Increases from ~2.4 to ~2.7.
* RSD-C (green): Increases from ~2.4 to ~2.8.
* RSD-S (blue): Increases from ~2.5 to ~3.1.
* **MBSU:**
* SD (orange): Increases from ~2.3 to ~2.5.
* SpecTr (red): Increases from ~2.4 to ~2.6.
* RSD-C (green): Increases from ~2.4 to ~2.7.
* RSD-S (blue): Increases from ~2.5 to ~3.2.
* **Token rate:**
* SD (orange): Decreases from ~1.9 to ~1.0.
* SpecTr (red): Remains relatively constant at ~1.8.
* RSD-C (green): Remains relatively constant at ~1.8.
* RSD-S (blue): Remains relatively constant at ~1.9.
* **Accuracy:** All methods remain constant at ~1.0.
#### Dolly
* **Block efficiency:**
* SD (orange): Increases from ~2.8 to ~3.0.
* SpecTr (red): Increases from ~2.9 to ~3.2.
* RSD-C (green): Increases from ~2.9 to ~3.2.
* RSD-S (blue): Increases from ~2.9 to ~3.3.
* **MBSU:**
* SD (orange): Increases from ~2.8 to ~3.1.
* SpecTr (red): Increases from ~2.8 to ~3.1.
* RSD-C (green): Increases from ~2.9 to ~3.1.
* RSD-S (blue): Increases from ~2.9 to ~3.3.
* **Token rate:**
* SD (orange): Decreases from ~2.3 to ~1.1.
* SpecTr (red): Remains relatively constant at ~2.2.
* RSD-C (green): Remains relatively constant at ~2.2.
* RSD-S (blue): Remains relatively constant at ~2.3.
* **Accuracy:** All methods remain constant at ~1.0.
### Key Observations
* **Block Efficiency and MBSU:** RSD-S (ours) generally achieves the highest block efficiency and MBSU across all models and tasks. All methods show an increase in block efficiency and MBSU as the number of tokens at the target increases.
* **Token Rate:** SD consistently shows a decreasing token rate as the number of tokens at the target increases. SpecTr, RSD-C, and RSD-S maintain a relatively stable token rate.
* **Accuracy:** Accuracy remains constant across all methods and tasks, suggesting it is not significantly affected by the number of tokens at the target or the different methods being compared.
* **Model Variation:** The performance varies across different models (Llama 2-70B, Llama 2-Chat-70B, Dolly) and tasks (WMT, XSum), indicating that the effectiveness of each method is dependent on the specific model and task.
### Interpretation
The data suggests that RSD-S (ours) generally outperforms the other methods (SD, SpecTr, RSD-C) in terms of block efficiency and MBSU. However, SD exhibits a decreasing token rate, which might be a trade-off for its performance in other metrics. The consistent accuracy across all methods indicates that the primary differences lie in efficiency and resource utilization. The choice of the best method would depend on the specific priorities and constraints of the application, considering the trade-offs between block efficiency, MBSU, and token rate. The "ours" denotation suggests that RSD-C and RSD-S are the focus of the study, and the results indicate their superiority in most metrics.