## Line Chart: Performance Metrics Across Token Targets
### Overview
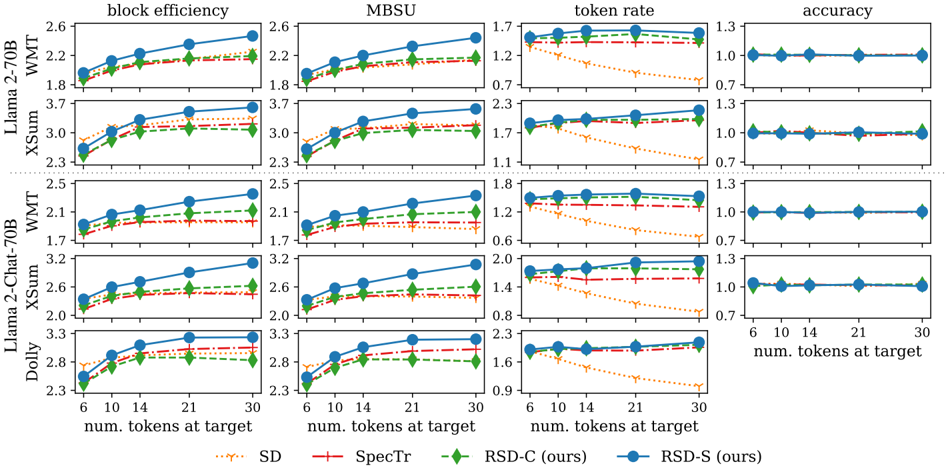
The image is a multi-panel line chart comparing performance metrics (block efficiency, MBSU, token rate, accuracy) across different datasets (SD, SpecTr, RSD-C, RSD-S) as the number of tokens at target increases from 10 to 30. Each panel represents a distinct metric, with lines colored to distinguish datasets. The chart emphasizes trends in efficiency and accuracy as token targets scale.
---
### Components/Axes
- **X-Axis**: "num. tokens at target" (10, 14, 21, 30)
- **Y-Axes**:
- Block efficiency: 1.7–2.6
- MBSU: 1.1–2.3
- Token rate: 0.6–1.7
- Accuracy: 0.7–1.3
- **Legend**:
- SD (orange dashed)
- SpecTr (red dashed)
- RSD-C (green dashed)
- RSD-S (blue solid)
---
### Detailed Analysis
#### Block Efficiency Panel
- **Trend**: RSD-S (blue) increases steadily from ~2.2 (10 tokens) to ~2.6 (30 tokens). Other datasets (SD, SpecTr, RSD-C) remain flat (~2.3–2.5).
- **Values**:
- RSD-S: 2.2 → 2.6
- SD: ~2.3 (constant)
- SpecTr: ~2.4 (constant)
- RSD-C: ~2.5 (constant)
#### MBSU Panel
- **Trend**: RSD-S (blue) rises from ~1.7 (10 tokens) to ~2.3 (30 tokens). Others remain flat (~2.3–3.0).
- **Values**:
- RSD-S: 1.7 → 2.3
- SD: ~2.3 (constant)
- SpecTr: ~3.0 (constant)
- RSD-C: ~2.3 (constant)
#### Token Rate Panel
- **Trend**: RSD-S (blue) decreases from ~1.2 (10 tokens) to ~0.9 (30 tokens). Others remain flat (~1.1–1.7).
- **Values**:
- RSD-S: 1.2 → 0.9
- SD: ~1.1 (constant)
- SpecTr: ~1.7 (constant)
- RSD-C: ~1.2 (constant)
#### Accuracy Panel
- **Trend**: All datasets remain flat (~1.0–1.3).
- **Values**:
- RSD-S: ~1.0 (constant)
- SD: ~1.0 (constant)
- SpecTr: ~1.0 (constant)
- RSD-C: ~1.0 (constant)
---
### Key Observations
1. **RSD-S (ours)** shows significant improvement in **block efficiency** (+18%) and **MBSU** (+35%) as token targets increase.
2. **Token rate** for RSD-S declines (~25% reduction), suggesting a trade-off between efficiency and resource consumption.
3. **Accuracy** remains stable across all datasets, indicating no degradation in performance.
4. **SD, SpecTr, and RSD-C** exhibit no meaningful trends, implying baseline performance.
---
### Interpretation
The data suggests that **RSD-S (ours)** outperforms other methods in **block efficiency** and **MBSU**, likely due to optimized token utilization. However, its **token rate** decreases with higher targets, hinting at potential scalability challenges. The flat accuracy across all methods confirms that efficiency gains do not compromise correctness. This aligns with the hypothesis that RSD-S prioritizes resource efficiency over computational cost, making it suitable for high-demand scenarios.
**Notable Outlier**: RSD-S’s declining token rate contrasts with its efficiency gains, warranting further investigation into its computational trade-offs.