## Line Chart: Accuracy vs. Attack Ratio for Federated Learning Algorithms
### Overview
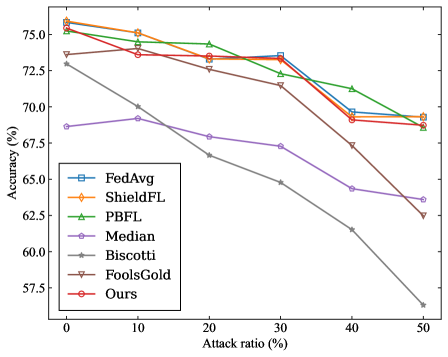
This line chart depicts the relationship between the attack ratio (percentage) and the accuracy (percentage) of several federated learning algorithms. The chart compares the performance of these algorithms under increasing adversarial conditions, represented by the attack ratio.
### Components/Axes
* **X-axis:** "Attack ratio (%)" - Ranges from 0% to 50%, with markers at 0, 10, 20, 30, 40, and 50.
* **Y-axis:** "Accuracy (%)" - Ranges from approximately 55% to 76%, with markers at 55, 60, 65, 70, 75.
* **Legend:** Located in the bottom-left corner, listing the following algorithms with corresponding line colors and markers:
* FedAvg (Blue, Square)
* ShieldFL (Orange, Circle)
* PBFL (Green, Triangle)
* Median (Purple, Diamond)
* Biscotti (Gray, Star)
* FoolsGold (Brown, Inverted Triangle)
* Ours (Red, Circle with a dot in the center)
### Detailed Analysis
Here's a breakdown of each line's trend and approximate data points, verified against the legend colors:
* **FedAvg (Blue, Square):** The line starts at approximately 69% accuracy at 0% attack ratio and slopes downward, reaching approximately 62% at 50% attack ratio. Data points (approximate): (0, 69), (10, 67), (20, 66), (30, 65), (40, 63), (50, 62).
* **ShieldFL (Orange, Circle):** The line begins at approximately 75% accuracy at 0% attack ratio, decreases to around 73% at 10%, remains relatively stable around 72-73% between 10% and 40% attack ratio, and then drops to approximately 68% at 50% attack ratio. Data points (approximate): (0, 75), (10, 73), (20, 72.5), (30, 73), (40, 72), (50, 68).
* **PBFL (Green, Triangle):** Starts at approximately 74% accuracy at 0% attack ratio, decreases to around 72% at 10%, remains relatively stable around 71-72% between 10% and 40% attack ratio, and then drops to approximately 68% at 50% attack ratio. Data points (approximate): (0, 74), (10, 72), (20, 71.5), (30, 71.5), (40, 71), (50, 68).
* **Median (Purple, Diamond):** The line starts at approximately 68% accuracy at 0% attack ratio and consistently decreases, reaching approximately 62% at 50% attack ratio. Data points (approximate): (0, 68), (10, 66), (20, 65), (30, 64), (40, 63), (50, 62).
* **Biscotti (Gray, Star):** The line shows a steep decline, starting at approximately 73% accuracy at 0% attack ratio and dropping to approximately 58% at 50% attack ratio. Data points (approximate): (0, 73), (10, 71), (20, 66), (30, 62), (40, 59), (50, 58).
* **FoolsGold (Brown, Inverted Triangle):** The line starts at approximately 74% accuracy at 0% attack ratio and decreases to approximately 63% at 50% attack ratio. Data points (approximate): (0, 74), (10, 72), (20, 69), (30, 66), (40, 64), (50, 63).
* **Ours (Red, Circle with a dot):** The line begins at approximately 75% accuracy at 0% attack ratio, decreases to around 73% at 10%, remains relatively stable around 72-73% between 10% and 40% attack ratio, and then drops to approximately 68% at 50% attack ratio. Data points (approximate): (0, 75), (10, 73), (20, 72.5), (30, 72.5), (40, 72), (50, 68).
### Key Observations
* Biscotti exhibits the most significant performance degradation with increasing attack ratio.
* FedAvg and Median show a relatively linear decrease in accuracy as the attack ratio increases.
* ShieldFL, PBFL, and Ours demonstrate more resilience to attacks up to approximately 40% attack ratio, maintaining accuracy above 70%.
* At 50% attack ratio, all algorithms experience a noticeable drop in accuracy, but ShieldFL, PBFL, and Ours still maintain a higher accuracy than FedAvg, Median, and Biscotti.
### Interpretation
The chart demonstrates the vulnerability of federated learning algorithms to adversarial attacks. The "attack ratio" likely represents the proportion of malicious participants in the federated learning process. The algorithms' accuracy decreases as the attack ratio increases, indicating that the presence of malicious actors negatively impacts the model's performance.
The varying slopes of the lines suggest different levels of robustness to attacks. Biscotti is particularly susceptible, while ShieldFL, PBFL, and "Ours" appear to be more resilient, potentially due to built-in defense mechanisms. The fact that all algorithms eventually suffer significant accuracy loss at a 50% attack ratio highlights the inherent challenges in securing federated learning systems against widespread malicious activity.
The "Ours" algorithm performs comparably to ShieldFL and PBFL, suggesting it offers a similar level of protection against attacks. The chart provides valuable insights for selecting appropriate algorithms and developing robust defense strategies in federated learning environments. The data suggests that even with robust algorithms, a high attack ratio can severely compromise the integrity of the federated learning process.