## Line Chart: Benchmark AIME24
### Overview
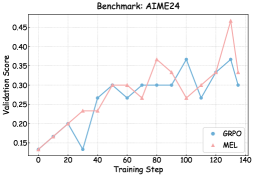
The image is a line chart comparing the validation scores of two models, GRPO and MEL, over training steps. The chart displays the performance of each model as the training progresses, allowing for a comparison of their learning curves.
### Components/Axes
* **Title:** Benchmark: AIME24
* **X-axis:** Training Step, ranging from 0 to 140 in increments of 20.
* **Y-axis:** Validation Score, ranging from 0.15 to 0.45 in increments of 0.05.
* **Legend:** Located in the bottom-right corner.
* GRPO (Blue)
* MEL (Pink)
### Detailed Analysis
* **GRPO (Blue):**
* The line starts at approximately 0.13 at training step 0.
* It decreases to approximately 0.13 at training step 30.
* It increases to approximately 0.27 at training step 40.
* It increases to approximately 0.30 at training step 60.
* It decreases to approximately 0.27 at training step 70.
* It increases to approximately 0.30 at training step 80.
* It remains at approximately 0.30 at training step 90.
* It increases to approximately 0.37 at training step 100.
* It decreases to approximately 0.27 at training step 110.
* It increases to approximately 0.33 at training step 120.
* It increases to approximately 0.37 at training step 130.
* It decreases to approximately 0.30 at training step 140.
* **MEL (Pink):**
* The line starts at approximately 0.13 at training step 0.
* It increases to approximately 0.20 at training step 20.
* It increases to approximately 0.23 at training step 30.
* It increases to approximately 0.27 at training step 40.
* It increases to approximately 0.30 at training step 50.
* It remains at approximately 0.30 at training step 60.
* It decreases to approximately 0.27 at training step 70.
* It increases to approximately 0.37 at training step 80.
* It decreases to approximately 0.33 at training step 90.
* It remains at approximately 0.33 at training step 100.
* It increases to approximately 0.37 at training step 110.
* It increases to approximately 0.46 at training step 130.
* It decreases to approximately 0.33 at training step 140.
### Key Observations
* Both GRPO and MEL models show an overall increasing trend in validation score as the training step increases, indicating learning.
* MEL generally outperforms GRPO, especially in the later training steps.
* Both models exhibit fluctuations in validation score, suggesting potential overfitting or instability during training.
### Interpretation
The line chart illustrates the learning curves of two models, GRPO and MEL, on the AIME24 benchmark. The validation scores indicate how well each model generalizes to unseen data during training. The MEL model appears to achieve higher validation scores than the GRPO model, suggesting it is a better performer on this benchmark. The fluctuations in the validation scores for both models could be due to various factors, such as the learning rate, batch size, or the inherent complexity of the dataset. Further analysis and hyperparameter tuning might be necessary to optimize the performance of both models.